简体中文
繁體中文
English
Pусский
日本語
ภาษาไทย
Tiếng Việt
Bahasa Indonesia
Español
हिन्दी
Filippiiniläinen
Français
Deutsch
Português
Türkçe
한국어
العربية
S&P 500, Nikkei 225 May Top as Samsung Sinks KOSPI. Markets Brace
Zusammenfassung:The Nikkei 225 formed a bearish reversal signal, dragged down by health-care stocks as Samsung Electronics sunk the KOSPI. Ahead, the S&P 500 may extend losses on US retail sales.
Asia Pacific markets slumped on Thursday, following Wall Street lower as US equities were dragged down by the health-care sector. Those concerns echoed into the Nikkei 225, as anticipated, where the Japanese index fell about 0.75%. Pharmaceuticals heavily underperformed, dragging down the index.
South Koreas KOSPI shed more than 1% of its value as it sunk with Samsung Electronics (a major component of the index). Reports crossed the wires that the new Galaxy Fold, a recently designed foldable phone set to be released on April 26, is breaking after just days of initial use.
Meanwhile, the Shanghai Composite declined more than 0.20% heading into the close as Australias benchmark ASX 200 was close to little changed. The latter is struggling to clear near-term resistance just under 6285.
US 2-year government bond prices rose, signaling risk aversion in the markets. The pro-risk New Zealand Dollar weakened across the board as the anti-risk Japanese Yen gained. AUD/USD was also somewhat negatively impacted, but a better-than-expected local jobs report stemmed losses.
S&P 500 futures are pointing notably lower, accompanied with bearish reversal signals. This hints that European and American financial markets may be in for a rough ride ahead. This may be exacerbated if US retail sales misses expectations, which has typically been the case with local data as of late.
Nikkei 225 Technical Analysis
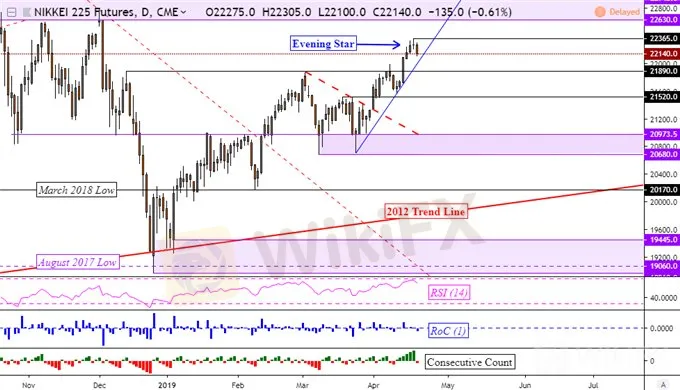
Looking at Nikkei 225 futures to show afterhours trade, the index has formed a bearish Evening Star candlestick pattern at the most recent peak. If there are to be losses ahead, keep a close eye on the rising support line from late March (blue line below). Clearing it may open the door to further losses.
Nikkei 225 Daily Chart

Chart Created in TradingView
Haftungsausschluss:
Die Ansichten in diesem Artikel stellen nur die persönlichen Ansichten des Autors dar und stellen keine Anlageberatung der Plattform dar. Diese Plattform übernimmt keine Garantie für die Richtigkeit, Vollständigkeit und Aktualität der Artikelinformationen und haftet auch nicht für Verluste, die durch die Nutzung oder das Vertrauen der Artikelinformationen verursacht werden.
WikiFX-Broker
Aktuelle Nachrichten
BYD steigert 2024 den Gewinn um ein Drittel – und überholt Konkurrenten Tesla beim Umsatz
Jeder Vierte arbeitet im Home Office – obwohl Unternehmen ihre Mitarbeiter wieder ins Büro holen wollen
Pharmakonzern Schwabe-Gruppe übernimmt Berliner Supplement-Startup Braineffect
Merz treibt deutsche Schuldenquote auf 75 bis 90 Prozent: Nun wird es noch wichtiger, dass die Wirtschaft schnell wieder wächst
Weltweite Nachfrage nach Atomkraft und erneuerbare Energien steigt – das sind die Treiber
Wechselkursberechnung


