简体中文
繁體中文
English
Pусский
日本語
ภาษาไทย
Tiếng Việt
Bahasa Indonesia
Español
हिन्दी
Filippiiniläinen
Français
Deutsch
Português
Türkçe
한국어
العربية
Holiday Surprise: U.S.-EU Agree on 15% Reciprocal Tariffs
Zusammenfassung:As July unfolds, each holiday seems to deliver market surprises. Following Vietnam and Japan, the U.S. and EU have finalized a reciprocal tariff agreement. The U.S. will reduce tariffs on EU imports t
As July unfolds, each holiday seems to deliver market surprises. Following Vietnam and Japan, the U.S. and EU have finalized a reciprocal tariff agreement. The U.S. will reduce tariffs on EU imports to 15%, while the EU has committed to purchasing $750 billion worth of U.S. energy over the next three years and investing an additional $600 billion to bolster economic and defense cooperation.
Following the announcement, the U.S. Dollar Index (DXY) gapped lower to 97.22, while U.S. risk assets surged in overnight trading, lifting Asian markets at the open. In contrast, precious metals lagged, with gold and silver prices under pressure. This reflects a continued FOMO-driven rotation into equities. Notably, although large speculators are increasing net long positions in precious metals, prices are diverging from position data. If speculators begin to unwind those longs, the outlook for gold prices based on positioning becomes increasingly bearish.
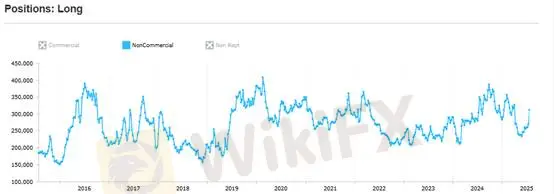
(Chart 1: CFTC Large Speculators Continue Increasing Long Positions in Gold)
The dollar index initially dropped sharply during Asia hours following the tariff announcement, but soon rebounded, paring losses. We believe this represents a short-term market mispricing, and recommend contrarian positions in assets that are negatively correlated with the dollar.
This mispricing is understandable. As noted earlier, the EUs pledge to buy $750 billion in U.S. energy and invest $600 billion more to support U.S. economic and defense initiatives—combined with the 15% reciprocal tariff—represents a major positive for the U.S. twin deficits (trade and fiscal). Therefore, our view on overvaluation of non-dollar currencies and precious metals remains unchanged. This is a short-term correction, and we view it as an opportunity for contrarian trades.
Gold Technical Analysis
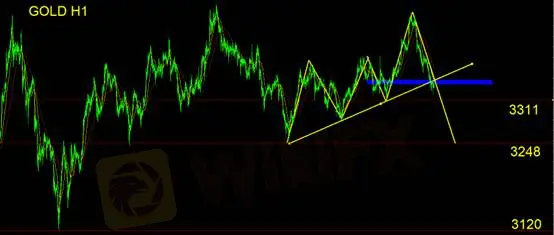
Golds short-term bullish trend has clearly ended, with prices breaking below the short-term ascending trendline. From a trading perspective, the focus should now be on selling into rebounds.
From the hourly chart pattern, current price action resembles a right-shoulder structure with neckline support at 3248. A break below this level could trigger a Fibonacci extension wave to estimate downside targets. Until 3248 is breached, we refrain from setting a downside target.
Support levels: 3311 / 3248 / 3120
Resistance zone: Former ascending trendline now acts as overhead pressure
Risk Disclaimer: The above views, analysis, research, price data, and related information are provided for general market commentary only and do not represent the views of our platform. All users must assume their own risks. Please trade cautiously.
Haftungsausschluss:
Die Ansichten in diesem Artikel stellen nur die persönlichen Ansichten des Autors dar und stellen keine Anlageberatung der Plattform dar. Diese Plattform übernimmt keine Garantie für die Richtigkeit, Vollständigkeit und Aktualität der Artikelinformationen und haftet auch nicht für Verluste, die durch die Nutzung oder das Vertrauen der Artikelinformationen verursacht werden.
WikiFX-Broker
Aktuelle Nachrichten
9.500.000.000 Dollar: Der größte Bitcoin-Cashout aller Zeiten?
 WikiFX
Ripple kracht – XRP 400 Mio. eingesammelt! Was planen die Großen?
WikiFXWechselkursberechnung

