简体中文
繁體中文
English
Pусский
日本語
ภาษาไทย
Tiếng Việt
Bahasa Indonesia
Español
हिन्दी
Filippiiniläinen
Français
Deutsch
Português
Türkçe
한국어
العربية
Gold Price: Supportive Risk-Off Rally on US-China Trade Fears
Abstract:The price of Gold picked up a safe-haven bid after the IMF warned of slowing global growth and renewed tensions between the US and China
Gold Price, News and Chart:
IMF warns on global growth, downgrades forecasts.
China warns over US extradition demand.
Q1 2019 Gold Forecast and Top Trading Opportunities
Gold Back in Favor but $1,300/oz. Remains an Obstacle
Global growth fears and renewed US -China tension sent risk-adverse investors back into the sanctuary of Gold. Yesterdays warning from the IMF that global growth was slowing, accompanied by downgrades from its October forecasts, cast a shadow over the WEF meeting in Davos, with the report highlighting ongoing trade tensions between the US and China as one of its biggest headwinds.
IMF Warns of Risks to Global Growth, Advanced Economies to Fall Sharply
Adding to the safe-haven bid, the US plans to proceed with extradition proceedings against Huawei CFO Sabrina Meng Wanzhou from Canada to answer charges of banking irregularities in violation of US sanctions against Iran. China responded saying that both Canada and the US should be aware of the seriousness of the case and ‘take steps to rectify the mistake’. With US-China trade talks at an impasse, and with little progress seen on the thorny intellectual property issue, trade tensions are likelyto increase in the short-term, boosting risk-haven assets including Gold, the Japanese Yen (JPY) and the Swiss Franc (CHF).
How to Trade Gold: Top Gold Trading Strategies and Tips
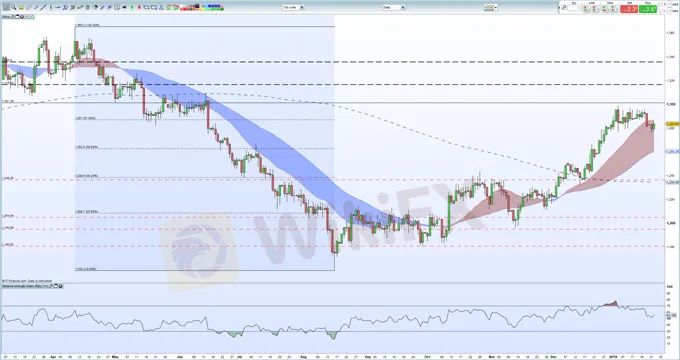
Gold now is stuck in a $1,275/oz. to $1,300/oz. range and needs further impulses to force a breakout. To the upside a break above $1,299/oz. would take the market back to levels last seen in mid-June last year, although the 61.8% Fibonacci retracement at $1,287/oz. will need to be broken cleanly again and closed above. To the downside, a break through the current range would target the 50% Fibonacci level at $1,262/oz. With current tensions and fears controlling market sentiment, a break higher looks more plausible in the short-term.
Gold Daily Price Chart (March 2018 – January 22, 2019)
Retail traders are 68% net-long US Crude according to the latest IC Client Sentiment Data, a bearish contrarian indicator. See how daily and weekly sentiment updates have an effect on our trading outlook.
Traders may be interested in two of our trading guides – Traits of Successful Traders and Top Trading Lessons – while technical analysts are likely to be interested in our latest Elliott Wave Guide.
What is your view on Gold – bullish or bearish? You can let us know via the form at the end of this piece or you can contact the author at nicholas.cawley@ig.comor via Twitter @nickcawley1.
Disclaimer:
The views in this article only represent the author's personal views, and do not constitute investment advice on this platform. This platform does not guarantee the accuracy, completeness and timeliness of the information in the article, and will not be liable for any loss caused by the use of or reliance on the information in the article.
Read more

The U.S. dollar index and U.S. Treasury yields rebounded at the same time; gold fell by more than 1%!
The initial value of the US S&P Global Manufacturing PMI in August was 48, which was lower than expected and the lowest in 8 months; the service PMI was 55.2, which exceeded the expected 54. The number of initial jobless claims in the week ending August 17 was 232,000, slightly higher than expected, and the previous value was revised from 227,000 to 228,000. Existing home sales in July increased for the first time in five months. The PMI data was lower than expected, which was bad for the US eco

The U.S. dollar index returned to the 103 mark; gold once plunged nearly $40 from its intraday high!
The monthly rate of retail sales in the United States in July was 1%, far exceeding expectations; the number of initial claims last week was slightly lower than expected, falling to the lowest level since July; traders cut their expectations of a rate cut by the Federal Reserve, and interest rate futures priced that the Federal Reserve would reduce the rate cut to 93 basis points this year. The probability of a 50 basis point rate cut in September fell to 27%. The data broke the expectation of a

Gold Price Stimulates by Geopolitical Tension
Gold prices experienced their largest gain in three weeks, driven by escalating tensions in the Middle East and the easing of the U.S. dollar as markets await the crucial CPI reading due on Wednesday. Gold has surged to an all-time high above $2,460, as uncertainties surrounding developments in both the Middle East and Eastern Europe persist push the demand for safe-haven assets higher.

KVB Today's Analysis: USD/JPY Eyes Volatility Ahead of BoJ Policy Meeting and US Data
The USD/JPY pair rises to 154.35 during the Asian session as the Yen strengthens against the Dollar for the fourth consecutive session, nearing a 12-week high. This is due to traders unwinding carry trades ahead of the Bank of Japan's expected rate hike and bond purchase tapering. Recent strong US PMI data supports the Federal Reserve's restrictive policy. Investors await US GDP and PCE inflation data, indicating potential volatility ahead of key central bank events.
WikiFX Broker
Latest News
Shocking! Oil Prices Plunge Below $60
 WikiFX
BI Alerts Filipinos: Telegram, Facebook Used for Trafficking Scams
WikiFXAUD/USD Hits New Lows as Panic Selling Unfolds Amid Robust U.S. Jobs Report
WikiFXFCA Released New List of Unauthorized Brokers
WikiFXHow to protect your money during Black Monday
WikiFXWall Street Funded Establishes Broker in St. Lucia to Reintroduce MetaTrader 5
WikiFXThink You’re Too Smart to Fall for an Investment Scam?!
WikiFXASIC Shuts Down 95 Scam Companies in Major Crackdown on Fraud
WikiFXTether Eyes U.S. Stablecoin Launch Amid Crypto Regulation Shifts
WikiFXCMC Markets Elevates Trading with TradingView Integration
WikiFXCurrency Calculator

