简体中文
繁體中文
English
Pусский
日本語
ภาษาไทย
Tiếng Việt
Bahasa Indonesia
Español
हिन्दी
Filippiiniläinen
Français
Deutsch
Português
Türkçe
한국어
العربية
XAUUSD: Spot Gold Price Chart Suggests Further Pullback Risk
Abstract:Spot gold is down roughly 4 percent since its recent peak in February, but the precious metal could see further downside.
SPOT GOLD PRICE – TALKING POINTS
Gold prices now rest below support at the $1,300 level after sustained downward pressure since topping out mid-February at the $1,345 area, which puts XAUUSD at risk for additional downside
Markets may continue to overlook gold in the short-term as risk-on sentiment gains momentum on the back of rebounding yields, improving economic data
New to trading or simply looking to sharpen your strategy? Read up on How to Trade Gold or learn about Trading the Gold to Silver Ratio
Gold appears to have lost some of its luster over the last month and a half with XAUUSD selling off nearly 4 percent since spot prices peaked mid-February. Now, gold sits below technical support at the $1,300 price level which could put the precious metal at risk for further short-term downside.
SPOT GOLD PRICE CHART: DAILY TIME FRAME (AUGUST 15, 2018 TO APRIL 1, 2019)
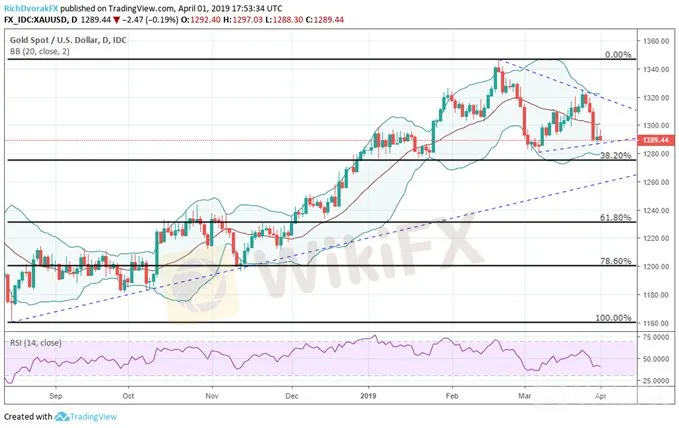
With spot gold‘s latest plunge, prices could extend even lower towards the 38.2 percent Fibonacci retracement line to find support around $1,280. Aside from the bearish technical picture, rebounding yields could further exacerbate gold’s recent weakness.
Gold failed to mirror the anti-risk rally in Treasuries over the second half of March which was largely triggered by the Federal Reserve announcing its latest dovish position and downward revisions to economic growth forecasts. The decline in the US 10-Year Treasury yield from 2.76 percent at the beginning of last month down to 2.36 percent on March 27 – its lowest level since December 18, 2017 – has since rebounded sharply back to 2.49 percent.
Take a look at this free educational guide on Building Confidence in Trading
Recent manufacturing data out of China and the US could be sparking the latest risk-on rally after both countries showed improvement. Consequently, the latest economic readings may suggest that fears of slowing global growth are overdone which in turn could push yields higher and gold prices lower considering their inverse relationship. That being said, the short-term uptrend line formed by the lows in spot gold on March 7 and March 29 could provide technical support.
SPOT GOLD TRADER CLIENT SENTIMENT
Check out IGs Client Sentiment here for more detail on the bullish and bearish biases of EURUSD, GBPUSD, USDJPY, Gold, Bitcoin and S&P500.
According to spot gold client positioning data from IG, 76.9 percent of traders are net long resulting in a ratio of traders long to short of 3.32 to 1. Despite the dip in XAUUSD from the $1,320 price level, spot gold traders have increased their bullish bias with the number of traders net-long rising 7.5 percent relative to last week.
Disclaimer:
The views in this article only represent the author's personal views, and do not constitute investment advice on this platform. This platform does not guarantee the accuracy, completeness and timeliness of the information in the article, and will not be liable for any loss caused by the use of or reliance on the information in the article.
Read more

Gold Soars Above $3,350 as XAU/USD Rallies on Trade Tensions
Gold (XAU/USD) surges past $3,350 amid renewed trade tensions and safe-haven demand. Discover the latest price action, technical levels, and market drivers.

Revealing Factors That Help Determine the Gold Price in India
Want to know why gold prices differ from one place to another in India? It's because of these top reasons. Read this interesting gold story.

Gold Rush Again: What's Driving the Bullion Market Crazy Ahead of US Jobs Data?
Gold prices rebounded on July 1 owing to a declining US dollar and mounting concerns over US trade tariffs. Investors resorted to the yellow metal as key US economic and policy data is about to be made public.

Breakthrough again! Gold breaks through $2530 to set a new record high!
Spot gold continued its record-breaking rally as investors gained confidence that the Federal Reserve might cut interest rates in September and gold ETF purchases improved. The U.S. market hit a record high of $2,531.6 per ounce
WikiFX Broker
Latest News
Top Wall Street analysts are upbeat about these dividend-paying stocks
 WikiFX
Singapore's economy grows 4.3% in second quarter, beating expectations
WikiFXIn middle of Trump's trade war, importers hold more cash and move inventory off the books
WikiFXAsia-Pacific markets trade mixed as investors assess Trump's latest tariff threats; bitcoin hits new highs
WikiFXGold Soars Above $3,350 as XAU/USD Rallies on Trade Tensions
WikiFXWhat WikiFX Found When It Looked Into Emar Markets
WikiFXShort or Long Term: Which to Choose for Double-Digit Returns from Gold Investments?
WikiFXWhat is Forex Trading Simulator?
WikiFXMT4 vs MT5 Which Forex Trading Platform Fits Your Needs in 2025?
WikiFXStock futures slide on more Trump tariff letters, but are off worst levels of session: Live updates
WikiFXCurrency Calculator

