简体中文
繁體中文
English
Pусский
日本語
ภาษาไทย
Tiếng Việt
Bahasa Indonesia
Español
हिन्दी
Filippiiniläinen
Français
Deutsch
Português
Türkçe
한국어
العربية
TradingView Unveils Time Price Opportunity Chart for Enhanced Market Analysis
Abstract:TradingView introduces a new Time Price Opportunity chart type, allowing traders to better analyze price activities and set precise targets through detailed visual profiles. This feature caters exclusively to Premium users.

TradingView has announced the launch of a new kind of chart called the Time Price Opportunity (TPO). Traders are poised for positive developments as this novel instrument aims to equip users with an enhanced comprehension of market operations. As a result, they can spot price junctures with high activity and make more accurate predictions about the market's future direction.

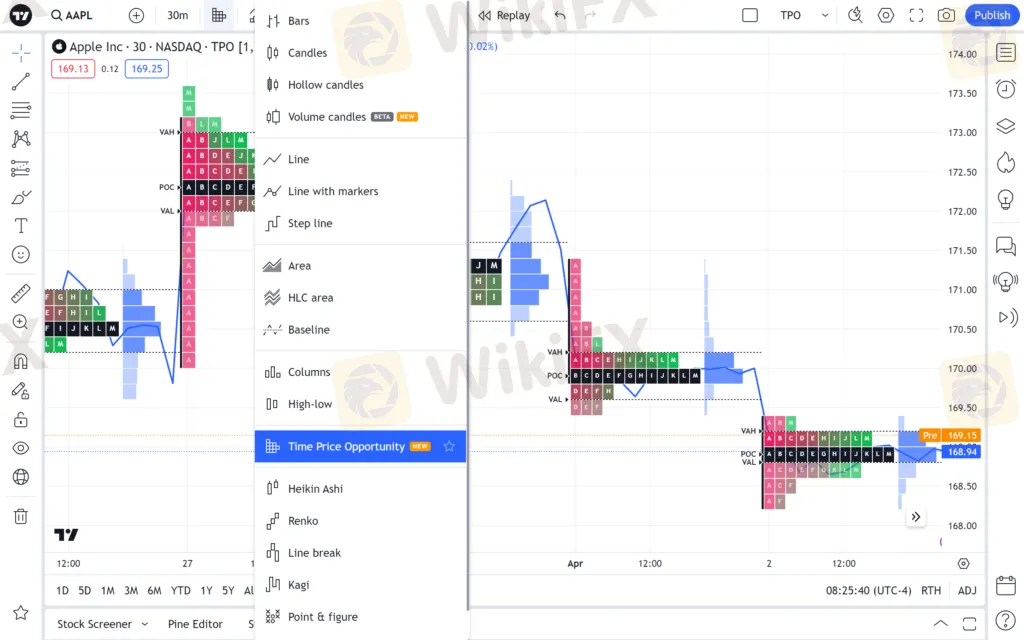
The TPO chart provides traders with a comprehensive view of price swings happening at certain periods, such as daily, weekly, and monthly. It facilitates through the TPO profile, prominently positioned on the left side of the chart, while the Volume Profile takes its place on the right. A central price line also serves as an additional reference point, enhancing the depth of data available for analysis.
One of the TPO chart's distinguishing advantages is its customizability. Traders can adjust the charts horizontal granularity, which determines the size of the time blocks dividing each period. Options for these blocks range from a compact five minutes to a more extended four-hour span. These blocks are uniquely identified with letters, such as “A” for the initial time block of a period, with subsequent blocks labeled consecutively. This labeling helps traders easily track price activity and its distribution through the trading period.

Additionally, the chart can automatically set the vertical granularity of each row in a profile or the user can manually specify the precise number of price ticks per row. This feature allows the traders to get an exact view of price levels that have seen the maximum and minimum activity, thus enabling more informed decision-making.
TradingView has also enhanced the usability of the TPO chart with neatly grouped settings. In the Line section, traders can select the underlying data for the price chart and customize its appearance. The Time Price Opportunity area allows changes to the main profile attributes, including colors and block, row, and period sizes. Additionally, the Lines and Labels section for the TPO profile offers further customization options, including the activation of various analytical lines like Point of Control (POC), Value Area High (VAH), Value Area Low (VAL), and others.

Accessibility to the TPO chart is exclusive to users with a Premium subscription or higher, aligning with TradingView's strategy of adding value to its more advanced service tiers. The company is making this change as part of a larger plan to keep improving the platform's features. The latest edition of the Volume Candles chart type is a big update that shows TradingView is still dedicated to giving its users the most up-to-date trade tools.
Trading strategies that aim to obtain an advantage must incorporate instruments such as the TPO chart, as the complexity of financial markets continues to rise. TradingView's TPO chart type is positioned to become an indispensable tool for market participants seeking to refine their trading decisions and conduct more in-depth market analyses, owing to its customizable options and sophisticated features.

Disclaimer:
The views in this article only represent the author's personal views, and do not constitute investment advice on this platform. This platform does not guarantee the accuracy, completeness and timeliness of the information in the article, and will not be liable for any loss caused by the use of or reliance on the information in the article.
Read more

Forex Hedging: Is It a Trader’s Safety Net or Just an Illusion?
In the volatile world of forex trading, risk is inevitable. One widely used strategy is forex hedging, which is a useful technique designed not to eliminate risk entirely, but to reduce its potential impact. As global economic uncertainty persists, understanding how hedging works could be an essential addition to a trader’s toolkit.

Thinking of Investing? Read Must-Know Facts About Funding pips!
When you check the internet for Funding Pips, you'd be surprised to know it's filled with praise for Funding Pips but often lacks the real facts that traders need. Everything that seems too good to be true should always be verified first. It could be Fraud . So, we conducted research and collected several facts you must know about Funding Pips.

OctaFX Back in News: ED Attaches Assets Worth INR 134 Cr in Forex Scam Case
The Enforcement Directorate (ED) in Mumbai has attached assets worth around INR 131.45 crore. This included a luxury yacht and residential properties in Spain. Read this interesting story.

Oil Prices Stay Firm on Solid US Jobs Data
Oil prices stayed firm this week as the US labour department posted a better-than-expected payroll data in June 2025. Read this news in detail.
WikiFX Broker
Latest News
He Thought He Earned RM4 Million, But It Was All a Scam
CryptoCurrency Regulations in India 2025 – Key Things You Should Know
OctaFX Back in News: ED Attaches Assets Worth INR 134 Cr in Forex Scam Case
Trump inaugural impersonators scammed donors out of crypto, feds say
Ethereum is powering Wall Street's future. The crypto scene at Cannes shows how far it's come
Forex Hedging: Is It a Trader’s Safety Net or Just an Illusion?
US debt is now $37trn – should we be worried?
OPEC+ members agree larger-than-expected oil production hike in August
Dukascopy Ends EOS/USD Trading Amid Liquidity Issues
FIBO Group MT5 Cent Account with Ultra-Leverage up to 1:5000 for Beginners
Currency Calculator


