简体中文
繁體中文
English
Pусский
日本語
ภาษาไทย
Tiếng Việt
Bahasa Indonesia
Español
हिन्दी
Filippiiniläinen
Français
Deutsch
Português
Türkçe
한국어
العربية
Asia Stocks Embrace Prospects of US Avoiding Another Shutdown

एब्स्ट्रैक्ट:Asia Pacific stocks extended the upbeat mood in markets after it seemed that the US might not reenter a shutdown. Despite its impressive rally, the
Asia Pacific Markets Wrap Talking Point
Asia Pacific equities follow European shares higher after mixed US sessio
Hopes of the US avoiding a shutdown bolstered sentiment, JPY depreciated
Nikkei 225 has best day since December, but still needs to clear resistance
Find out what retail traders equities buy and sell decisions say about the coming price trend!
Asia Pacific equities generally traded higher following an upbeat European and mixed US trading session. The former seemed to have been because of a report from the Bank of France that its home country may not contract in the first quarter of 2019. Given how much concerns have been raised as of late about souring global growth, it would appear to make sense that nations avoiding recessions spurs risk appetite.
Meanwhile during the APAC session, reports crossed the wires that an agreement in principle has been reached in US shutdown talks. The Nikkei 225 rallied about 2.5% (after being closed Monday) in its best day since December 2018. Australia‘s ASX 200 also climbed, rising 0.3% as we headed into Tuesday’s close. Chinas Shanghai Composite also climbed 0.52% at the time of this writing.
Looking at currencies, the anti-risk Japanese Yen aimed cautiously lower. Meanwhile the pro-risk Australian Dollar gained. S&P 500 futures are pointing notably higher, suggesting that sentiment may continue improving over the remainder of the day. This will then be tested when BoE Governor Mark Carney and Fed Chair Jerome Powell speak later today.
Nikkei 225 Technical Analysi
The rise in the Nikkei 225, while impressive, still left it sitting right on the descending trend line from October 2018. A close above it followed by another one beyond 21,035 (outer range of now horizontal resistance) may open the door to more gains down the road.
Nikkei 225 Daily Chart
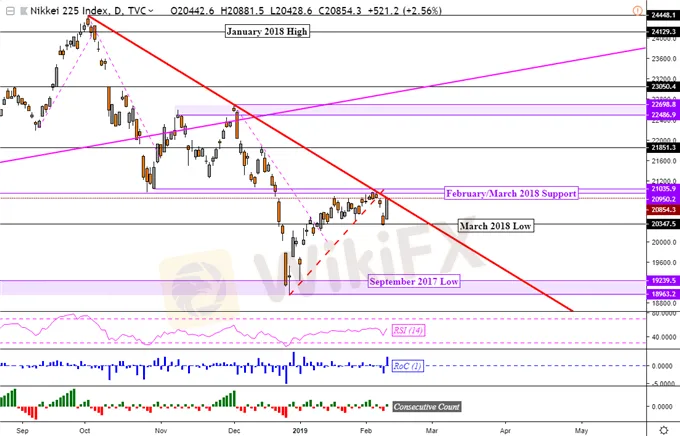
Chart created in TradingView
अस्वीकरण:
इस लेख में विचार केवल लेखक के व्यक्तिगत विचारों का प्रतिनिधित्व करते हैं और इस मंच के लिए निवेश सलाह का गठन नहीं करते हैं। यह प्लेटफ़ॉर्म लेख जानकारी की सटीकता, पूर्णता और समयबद्धता की गारंटी नहीं देता है, न ही यह लेख जानकारी के उपयोग या निर्भरता के कारण होने वाले किसी भी नुकसान के लिए उत्तरदायी है।
WikiFX ब्रोकर
रेट की गणना करना

