简体中文
繁體中文
English
Pусский
日本語
ภาษาไทย
Tiếng Việt
Bahasa Indonesia
Español
हिन्दी
Filippiiniläinen
Français
Deutsch
Português
Türkçe
한국어
العربية
Dow Jones Outlook: Index Awaits US GDP on Shaky Ground
Ikhtisar:The Dow Jones will await Thursdays release of annualized GDP data as US indices stand on a shaky fundamental backdrop and industrials stumble under pressure.
Dow Jones Outlook Talking Points:
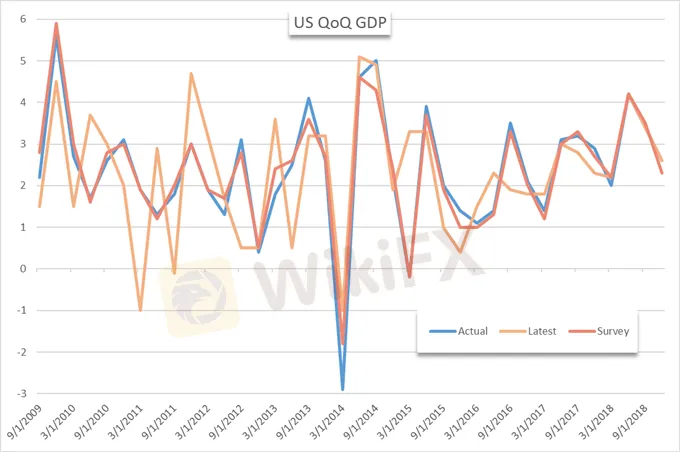
US GDP is expected at 2.40%, but a recent deterioration in other economic data may see the figure disappoint
The Dow Jones trades at a precarious position with storm clouds above US markets
For a deeper look into global equities, sign up for my weekly webinar - Stock Market Catalysts in the Week Ahead
Dow Jones Outlook: Index Awaits US GDP on Shaky Ground
The Dow Jones will look to Thursday‘s release of the finalized GDP data from the United States. While the initial fourth quarter figure – which often has a larger market reaction - was released a month ago, the final yearly data print is still subject to revisions and could deliver a shock to the Industrial Average given the landscape. The current standing of the Dow Jones and other US indices appears vulnerable and a disappointing conclusion to last year’s data could take advantage of that vulnerability.
US Gross Domestic Product Quarter over Quarter (Chart 1)
See how IG clients are positioned on various currencies and assets with IG Client Sentiment Data.
According to the put-call ratio of the S&P 500, some traders have braced for bearish price action – possibly envisioning a negative data print or a continuation of the recent risk-off attitude due to other factors. The ratio of puts to calls on the index climbed to 0.98 in Wednesday trading, the highest since January 10 when the S&P 500 traded below 2,600 and the ratio was 1.
S&P 500 Price and Put-Call Ratio (Chart 2)

That said, some sectors may be more vulnerable than others. Manufacturing is one of the more sensitive industries to economic production as the outlook for growth can help or hurt companies that rely on continuous expansion.
Dow Jones Price Chart: Daily Time Frame (January 2018 – March 2019) (Chart 3)

Dow Jones price chart overlaid with ratio of S&P 500 to XLI ETF in red
The industrial-tracking XLI ETF has recently lagged the broader S&P 500 likely due to considerable concern over slowing global growth and in part because of Boeings recent struggles. A poor GDP print would prove troublesome for the industry and likely contribute to further underperformance in the sector.
Dow Jones Price Chart: 4 – Hour Time Frame (October 2018 – March 2019) (Chart 4)

Today, the index finds itself trading indecisively in a narrowing wedge, with opportunities for a continuation higher – despite the apparent fundamental headwinds.
Disclaimer:
Pandangan dalam artikel ini hanya mewakili pandangan pribadi penulis dan bukan merupakan saran investasi untuk platform ini. Platform ini tidak menjamin keakuratan, kelengkapan dan ketepatan waktu informasi artikel, juga tidak bertanggung jawab atas kerugian yang disebabkan oleh penggunaan atau kepercayaan informasi artikel.
WikiFX Broker
Berita Terhangat
Pengumuman WikiFX: Penghentian Kompetisi Simulasi Trading Mingguan
 WikiFX
DENDA Lampaui €2,7 Juta ! Tekanan Peraturan Baru Uni Eropa pada Perusahaan Keuangan Siprus
WikiFXWawancara Pakar Global WikiEXPO: JinDao Tai — Masa Depan Perdagangan Valas
WikiFXPotensi KEHILANGAN $274 Juta Apabila ASIC Melikuidasi Dana Investasi Bermasalah
WikiFXLisensi Broker Lepas Pantai Membuka Peluang Prop Firm Terhadap Metatrader 5
WikiFXTransformasi Perombakan SEC, Pakar Peringatkan "Kematian Akibat 1.000 Pemotongan”
WikiFXBroker Forex ICM Peroleh Lisensi di UEA Setelah Setahun Keluar dari Inggris
WikiFXMenjembatani Kepercayaan, Menjelajahi yang Terbaik WikiEXPO Hong Kong 2025 Berakhir Spektakuler
WikiFXNilai Tukar

