简体中文
繁體中文
English
Pусский
日本語
ภาษาไทย
Tiếng Việt
Bahasa Indonesia
Español
हिन्दी
Filippiiniläinen
Français
Deutsch
Português
Türkçe
한국어
العربية
Crude Oil Price Outlook Remains Fragile - Will Near-Term Support Hold?
Ikhtisar:Crude oils sharp sell-off has halted in the short-term as the market hits support off an important Fibonacci level.
Crude Oil Price Chart and Analysis:
Crude oil hits support – will it hold?
Oil looks heavily oversold in the short-term.
The Brand New DailyFX Q2 2019 Trading Forecast and Guides are Available to Download Now!!
How to Trade Oil: Crude Oil Trading Strategies & Tips.
Crude Oil Slump
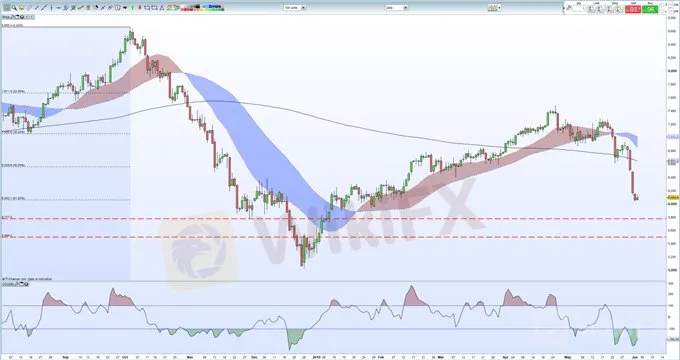
The price of a barrel of crude oil fell by over 12% last week as trade fears heightened, undermining global growth concerns. Oil also fell through noted support levels, including the 200-day moving average, which accelerated the move lower and took oil to a five-month low. We warned two-weeks ago that chart support looked weak with the 50% Fibonacci retracement level breached in subsequent days.
Oil has now bounced off the 61.8% Fibonacci retracement level and this may hold in the short-term, unless trade war rhetoric increases. The crude oil chart is also flashing an extreme oversold signal with the CCI indicator at once stage hitting -250, a level not seen since mid-December last year when the price of oil touched $50.0/bbl.
Support on the chart is seen at $60.63/bbl. – the previously mentioned Fibonacci retracement level –ahead of a cluster of highs/lows around the $59/bbl. area. Crude oil will need to consolidate around current levels, or higher, to start rebuilding some confidence in the market, which has fallen nearly 20% in less than six weeks. To the upside, the gap created on last Fridays (May 31) candle between $61.6/bbl. and $64.9/bbl. will be the bulls first target.
Crude Oil Price Collapses Through Key Supports: More to Go?
WTI vs Brent: Top 5 Differences Between WTI and Brent Crude Oil
Crude Oil Daily Price Chart (August 2018 – June 3, 2019)
Traders may be interested in two of our trading guides – Traits of Successful Traders and Top Trading Lessons – while technical analysts are likely to be interested in our latest Elliott Wave Guide.
Disclaimer:
Pandangan dalam artikel ini hanya mewakili pandangan pribadi penulis dan bukan merupakan saran investasi untuk platform ini. Platform ini tidak menjamin keakuratan, kelengkapan dan ketepatan waktu informasi artikel, juga tidak bertanggung jawab atas kerugian yang disebabkan oleh penggunaan atau kepercayaan informasi artikel.
WikiFX Broker
Berita Terhangat
DENDA Lampaui €2,7 Juta ! Tekanan Peraturan Baru Uni Eropa pada Perusahaan Keuangan Siprus
 WikiFX
Potensi KEHILANGAN $274 Juta Apabila ASIC Melikuidasi Dana Investasi Bermasalah
WikiFXLisensi Broker Lepas Pantai Membuka Peluang Prop Firm Terhadap Metatrader 5
WikiFXBroker Forex ICM Peroleh Lisensi di UEA Setelah Setahun Keluar dari Inggris
WikiFXMenjembatani Kepercayaan, Menjelajahi yang Terbaik WikiEXPO Hong Kong 2025 Berakhir Spektakuler
WikiFXNilai Tukar

