简体中文
繁體中文
English
Pусский
日本語
ภาษาไทย
Tiếng Việt
Bahasa Indonesia
Español
हिन्दी
Filippiiniläinen
Français
Deutsch
Português
Türkçe
한국어
العربية
Oil Market Expected to be Worse Because of Dropping in US Stock and Oil
Ikhtisar:the US stock index and yields have reported to bounce off recently after the release of the US non-farm payrolls report, or NFP, in August.
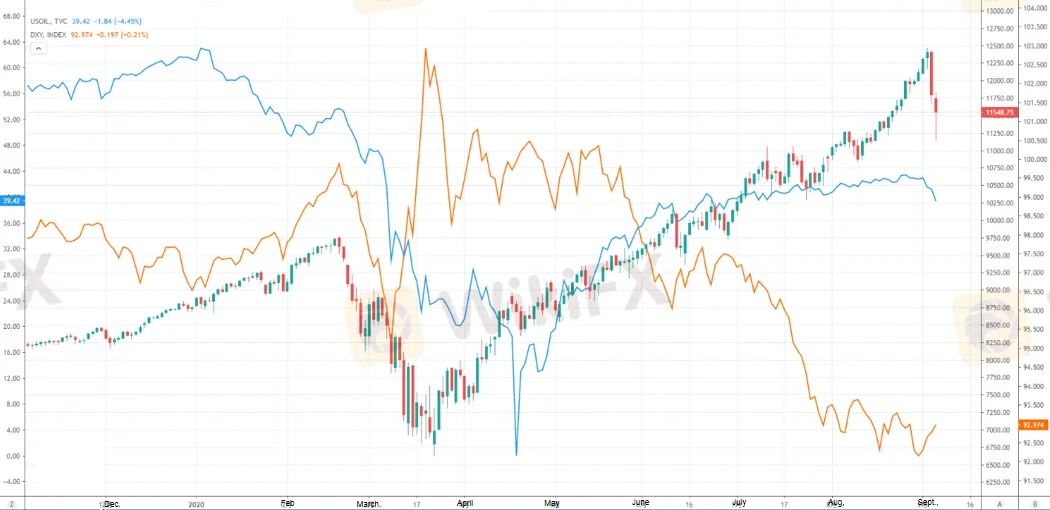
WikiFX News (7 Sept) - the US stock index and yields have reported to bounce off recently after the release of the US non-farm payrolls report, or NFP, in August, with the index rising to an intraday high level of 93.24, hitting a week high; WIT crude oil falling to an intraday low level of 39.35 dollars, recording a month low.
The NFP in August showed that jobs increased by 1.371 million and unemployment rate decreased by 8.4%. Although it revealed an optimistic market, the working population, objectively speaking, presents a sign of slowdown. In addition, the permanent unemployment rose to 3.4 million. Therefore, there are great uncertainties about the recovery in the US economy.
According to the performance of US stock on Sept. 4th, it is obvious that the US stock wasnt stronger for benefiting from the NFP and three benchmark indexes generally dropped. It is expected that the oil may encounter further the sustained selling pressure from the US stock.
This Saturday will see the interest rate decision in September by the European Central Bank (ECB). Considering the worse European coronavirus situation, the ECB warned last week that the euro depreciated fast. The more easing signals by the ECB may put pressure on the euro, strengthen the US stock index and drive further downside in the gold price.
Moreover, the adds are that the oil demand becomes worse during the upcoming seasonal shutdown maintenance of oil refineries. The oil price, so far, has fallen below the level of 40 dollars, and is expected to be confronted with selling pressure if it cannot break upward the level of 41.3 dollars in the near term.
All the above is provided by WikiFX, a platform world-renowned for foreign exchange information. For details, please download the WikiFX App: bit.ly/WIKIFX

Three benchmark indexes chart
Disclaimer:
Pandangan dalam artikel ini hanya mewakili pandangan pribadi penulis dan bukan merupakan saran investasi untuk platform ini. Platform ini tidak menjamin keakuratan, kelengkapan dan ketepatan waktu informasi artikel, juga tidak bertanggung jawab atas kerugian yang disebabkan oleh penggunaan atau kepercayaan informasi artikel.
WikiFX Broker
Exness
EC Markets
GO MARKETS
ATFX
AVA Trade
STARTRADER
Exness
EC Markets
GO MARKETS
ATFX
AVA Trade
STARTRADER
WikiFX Broker
Exness
EC Markets
GO MARKETS
ATFX
AVA Trade
STARTRADER
Exness
EC Markets
GO MARKETS
ATFX
AVA Trade
STARTRADER
Berita Terhangat
WikiFX Mengucapkan Selamat Hari Raya Idul Fitri 1446 H, Mohon Maaf Lahir dan Batin
Broker StoneX Meningkatkan Investasi Perbankan dan Perdagangan Dengan Akuisisi Benchmark
Interactive Brokers Menambahkan Bursa Efek Ljubljana Dan Mengintegrasikan CoacsConnect
Nilai Tukar


