简体中文
繁體中文
English
Pусский
日本語
ภาษาไทย
Tiếng Việt
Bahasa Indonesia
Español
हिन्दी
Filippiiniläinen
Français
Deutsch
Português
Türkçe
한국어
العربية
Alphabet Hikes CAPEX Guidance, Fuels Investor Optimism and Risk Appetite
Sommario:As the U.S. enters a critical earnings season, risk assets continue to climb, driven by Alphabets upbeat forward guidance. Alphabets strong earnings helped ease investor concerns over an AI bubble, as
As the U.S. enters a critical earnings season, risk assets continue to climb, driven by Alphabets upbeat forward guidance. Alphabet's strong earnings helped ease investor concerns over an AI bubble, as the company raised its full-year capital expenditures (CAPEX) forecast from $75 billion to $85 billion.
")
(Chart 1. Tech Sector Leading the Broader Risk-On Rally; Source: Finviz)
The growing adoption of AI chatbots and Googles AI Overview has also helped boost search advertising revenue, which not only held steady but actually accelerated from the previous quarter. Meanwhile, the cloud business posted explosive growth, with revenue surging to $13.6 billion, up 32% year-over-year. Operating income hit $2.8 billion, with an operating margin up 20.7% YoY.
")
(Chart 2. Operating Income and Margin Performance; Source: Alphabet)
While earnings reports remain strong, we continue to caution investors from a macroeconomic perspective. U.S. equity markets appear to have entered a phase of irrational exuberance. As the rally extends, the risk of chasing highs cannot be ignored.
The CNN Fear & Greed Index—a high-frequency sentiment gauge—remains at an elevated 75%, indicating extreme greed.
")
(Chart 3. CNN Fear & Greed Index; Source: CNN)
Weve also consistently highlighted the U.S. Dollar Index (DXY) entering a bottoming phase. Despite its drop from 109 to 96—mainly due to excessive pessimism and broad-based selling—current corporate earnings have reassured markets, signaling limited downside risk for the dollar.
Additionally, according to the latest Fund Manager Survey (FMS), dollar asset allocations remain one standard deviation below the long-term historical average. With strong earnings momentum in the U.S., fund managers are likely to rotate capital back into dollar-denominated assets, which may support continued USD strength.
On the flip side, eurozone assets remain significantly overweight—over two standard deviations above historical norms—while cash levels among fund managers are unusually low. This implies a potential for major portfolio rebalancing. In simple terms, managers may begin locking in gains from European equities and reallocate towards U.S. dollar assets.
We believe this trend is now crystal clear. Non-dollar currencies appear substantially overvalued. Investors may consider identifying short opportunities in overbought non-USD currencies—particularly those with the largest weightings in the DXY basket.
Gold: Closely Tied to USD Trends
We also observe a growing correlation between gold and the U.S. Dollar Index. Given the consistent pattern, gold traders may find value in using DXY trends as a guide for gold price direction.
Gold Technical Outlook
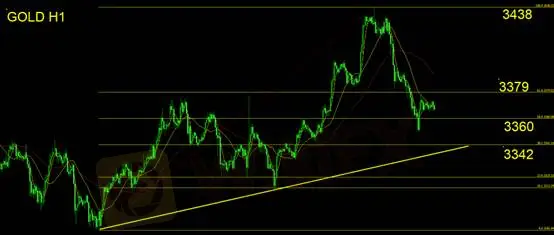
Gold has broken below the Fibonacci neutral zone support at $3360. The rebound has failed to surpass resistance at $3379. Technically, the key level to watch is $3342. A break below this support and the ascending trendline would suggest a shift from a short-term correction to a short-term bearish trend. Long positions are not recommended at this stage.
Stop-Loss Guidance: $20 per trade
Support Levels: $3360 / $3342
Resistance Levels: $3379 / $3438
Risk Disclaimer: The views, analysis, research, prices, and other information provided herein are for general market commentary only and do not represent the position of this platform. All users are solely responsible for their investment decisions. Please trade with caution.
Disclaimer:
Le opinioni di questo articolo rappresentano solo le opinioni personali dell’autore e non costituiscono consulenza in materia di investimenti per questa piattaforma. La piattaforma non garantisce l’accuratezza, la completezza e la tempestività delle informazioni relative all’articolo, né è responsabile delle perdite causate dall’uso o dall’affidamento delle informazioni relative all’articolo.
WikiFX Trader
Vantage
OANDA
STARTRADER
IC Markets Global
FXTM
FOREX.com
Vantage
OANDA
STARTRADER
IC Markets Global
FXTM
FOREX.com
WikiFX Trader
Vantage
OANDA
STARTRADER
IC Markets Global
FXTM
FOREX.com
Vantage
OANDA
STARTRADER
IC Markets Global
FXTM
FOREX.com
Rate Calc

