简体中文
繁體中文
English
Pусский
日本語
ภาษาไทย
Tiếng Việt
Bahasa Indonesia
Español
हिन्दी
Filippiiniläinen
Français
Deutsch
Português
Türkçe
한국어
العربية
Gold Soars to $3,400 as Safe-Haven Demand Reignites
Sommario:Gold prices surged to a one-month high of $3,400 per ounce on Monday, reflecting a renewed wave of safe-haven demand amid growing market uncertainty. The rally marks a significant breakout for the pre
Gold prices surged to a one-month high of $3,400 per ounce on Monday, reflecting a renewed wave of safe-haven demand amid growing market uncertainty. The rally marks a significant breakout for the precious metal, which had traded in a relatively quiet range in recent weeks.
Market Uncertainty Fuels Flight to Safety
The move followed a sharp pullback in the U.S. Dollar on Monday—a typically subdued trading day—amplifying golds upside momentum. The surge suggests investors are increasingly turning to gold as a hedge against both monetary policy uncertainty and rising trade-related risks.
Last week‘s U.S. inflation data revealed persistently sticky core prices, while early signs indicate that recent tariffs may be starting to seep into production and consumer costs—adding to gold’s bullish backdrop.
Geopolitical and Fiscal Tensions Add to Bullish Case
In addition to U.S. economic concerns, political instability and fiscal uncertainty in Japan, along with fears of escalating global trade tensions, have reinforced golds safe-haven status. Questions around U.S. fiscal discipline and broader market risks are further driving demand for the metal.
“Gold is once again proving its resilience as a safe-haven asset,” said Shawn Lee, Senior Market Analyst at Ultima Markets. “With inflation remaining sticky and geopolitical tensions rising, gold could see further upside in the near term.”
XAU/USD Forecast: Technical Outlook
Gold surged to $3,400 after breaking above the key consolidation resistance near $3,360, confirming a breakout from its recent rising wedge pattern. This bullish move signals potential for continued upside momentum in the near term.
However, stay cautious on the current resistance, as the $3,400 level represents a major psychological and technical resistance that may cap gains in the short run.
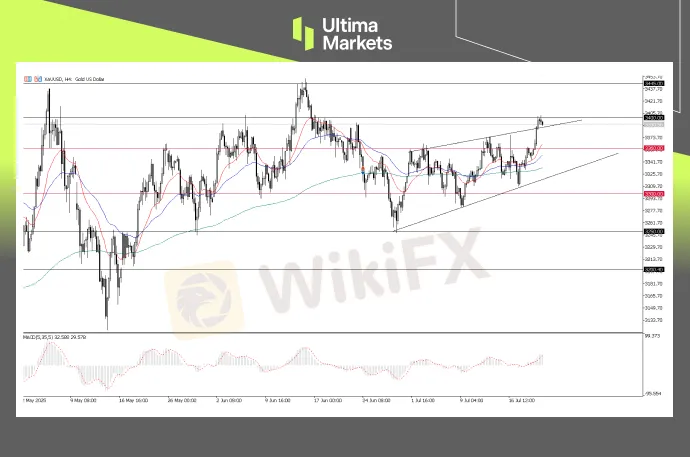
XAU/USD, 4-H Chart Analysis | Source: Ultima Market MT5
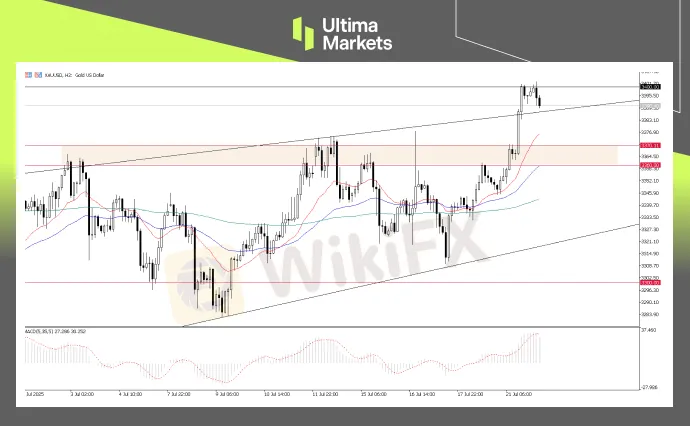
XAU/USD, 2-H Chart Analysis | Source: Ultima Market MT5
On the 2-hour chart, a pullback remains possible given the strong rally and overhead resistance. However, support is likely to emerge around the $3,360–$3,370 zone, which previously served as a key resistance. A successful retest of this area could confirm the breakout and reinforce bullish continuation.
Notably, the short-term 2-Hour Exponential Moving Average (EMA) is showing signs of a bullish crossover, adding technical confirmation to the current upside bias.
Disclaimer
Comments, news, research, analysis, price, and all information contained in the article only serve as general information for readers and do not suggest any advice. Ultima Markets has taken reasonable measures to provide up-to-date information, but cannot guarantee accuracy, and may modify without notice. Ultima Markets will not be responsible for any loss incurred due to the application of the information provided.
Disclaimer:
Le opinioni di questo articolo rappresentano solo le opinioni personali dell’autore e non costituiscono consulenza in materia di investimenti per questa piattaforma. La piattaforma non garantisce l’accuratezza, la completezza e la tempestività delle informazioni relative all’articolo, né è responsabile delle perdite causate dall’uso o dall’affidamento delle informazioni relative all’articolo.
WikiFX Trader
AvaTrade
ATFX
Vantage
IronFX
FXCM
XM
AvaTrade
ATFX
Vantage
IronFX
FXCM
XM
WikiFX Trader
AvaTrade
ATFX
Vantage
IronFX
FXCM
XM
AvaTrade
ATFX
Vantage
IronFX
FXCM
XM
Rate Calc

