简体中文
繁體中文
English
Pусский
日本語
ภาษาไทย
Tiếng Việt
Bahasa Indonesia
Español
हिन्दी
Filippiiniläinen
Français
Deutsch
Português
Türkçe
한국어
العربية
Using RSI Ranges to Understand Trends - Week 30 | Technical Analysis by Jasper Lawler
Sommario:Weekly thoughtsWe are back looking at the top-traded instruments after our dive into minor FX pairs last week in the Asia region.What we are doing is using the RSI indicator to help us define the poss
Weekly thoughts
We are back looking at the top-traded instruments after our dive into minor FX pairs last week in the Asia region.
What we are doing is using the RSI indicator to help us define the possible upper and lower limits within the trend.
We dont particularly need RSI to see what the trend is - the price is either rising from lower left to upper right forming higher highs and higher lows (uptrend) or moving from upper left to lower right and forming lower highs and lows (downtrend).
We dont even particularly need it to define upper and lower limits because we can use support and resistance, trendlines or even moving averages and Fibonacci levels.
But in trading - some extra clarity helps you pull the trigger.
And you need to pull the trigger for any hope of profit!
Thats why we incorporate the RSI (sometimes) to give us extra clarity.
A quick explainer: Heres how RSI ranges work..
In a sideways market, RSI typically oscillates between 30 and 70. Nothing too extreme — buyers and sellers are fairly balanced. But in a trending market, the RSI tends to shift into new zones:
In an uptrend, RSI tends to stay between 40 and 80, often bouncing around the 50–70 zone. Dips below 40 are rare and often signal a possible change in momentum.
In a downtrend, the range shifts lower — RSI tends to live between 20 and 60, rarely getting above 60. A sustained move above 60 can be an early sign of a potential bottom forming.
So instead of watching for single overbought or oversold readings, we‘re more interested in how RSI behaves relative to its usual range. This helps us stay aligned with the market’s underlying momentum — or catch when that momentum is breaking down.
To put it simply:
If RSI keeps bouncing from 40 up to 80 → likely still in an uptrend.
If its trapped between 20 and 60 → likely in a downtrend.
If its flipping between 30 and 70 → probably range-bound.
Were using this kind of RSI interpretation alongside price action and key levels — not as a standalone signal — but it does help stack the odds in your favour when looking for that next trade.
Setups & signals
We look at hundreds of charts each week and present you with three of our favourite setups and signals.
GoldSetup
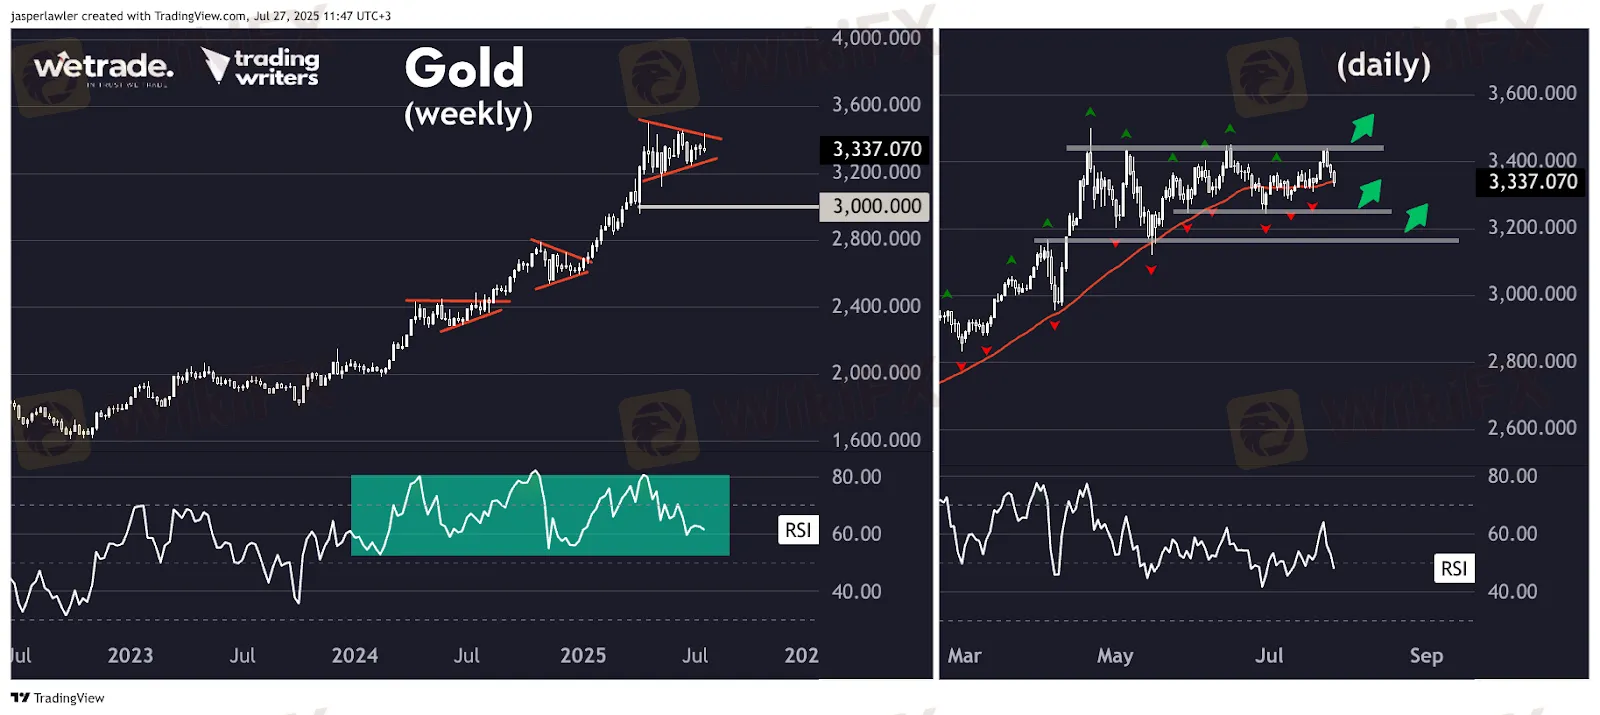
Weekly RSI is in a bullish range trading between 50 and 80. Although the price has stalled underneath 3500 - there is still no long term reason to turn short because the trend is still up.
While price is inside its triangle pattern, we will look for long opportunities but a break lower would mean no trades until a potential re-test of the big $3K level.
Signal
We are looking for opportunities to join the long term trend at two key support levels (3250 then 3170) or on a breakout of resistance (3450).
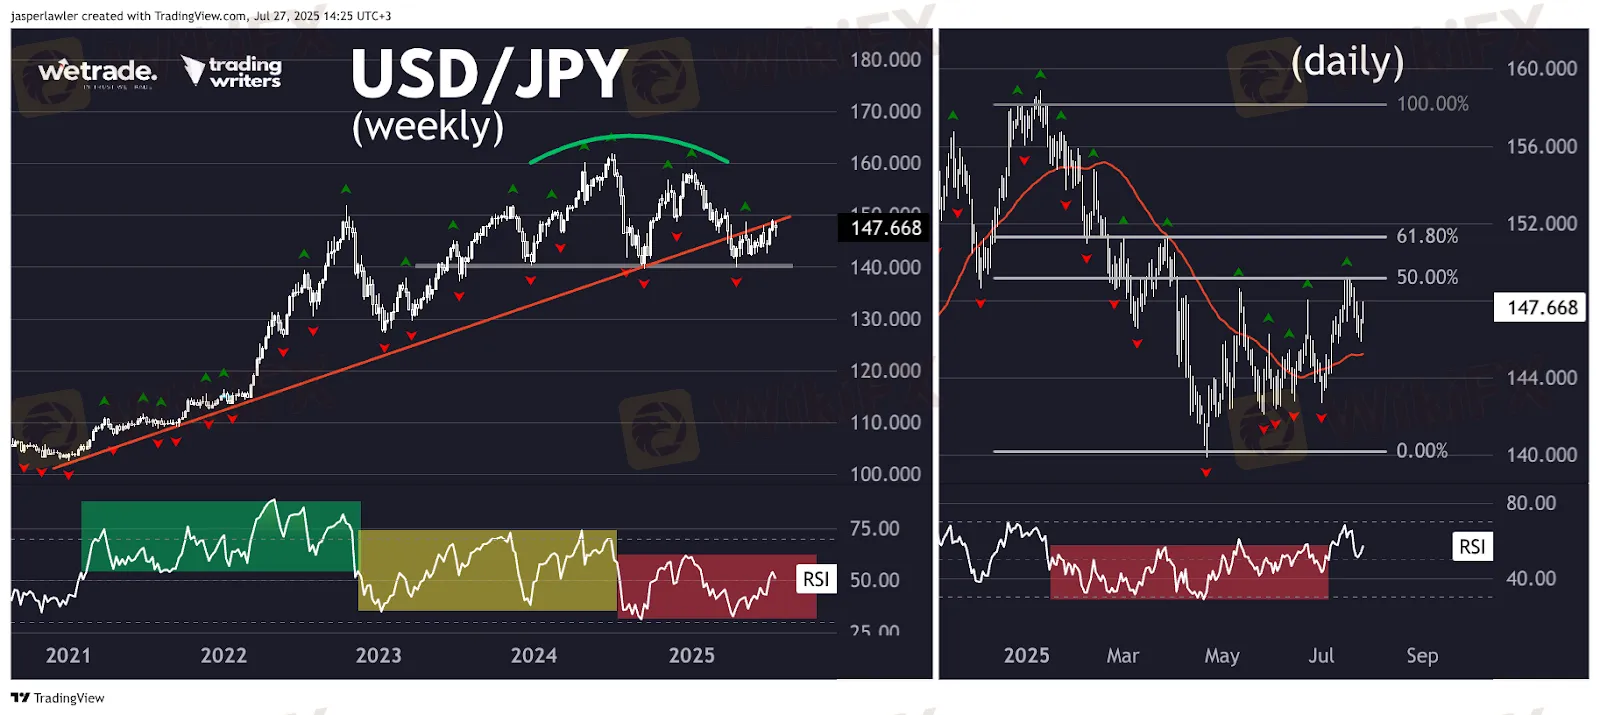
USD/JPYSetup
By highlighting the ranges that RSI is fluctuating in , we can see a little more clearly the changing momentum through the long uptrend shown by the rising trendline. As of now the trendline has broken and the RSI has hit oversold - entering a bearish range.
Signal
Daily RSI had been in a bearish range but with the most recent peak getting broken to the upside. This could suggest the price has a little further to bounce , which would make sense given the significance of the 140 level it is bouncing from. If the 50% Fib breaks, the 61.8% is the next one to watch.
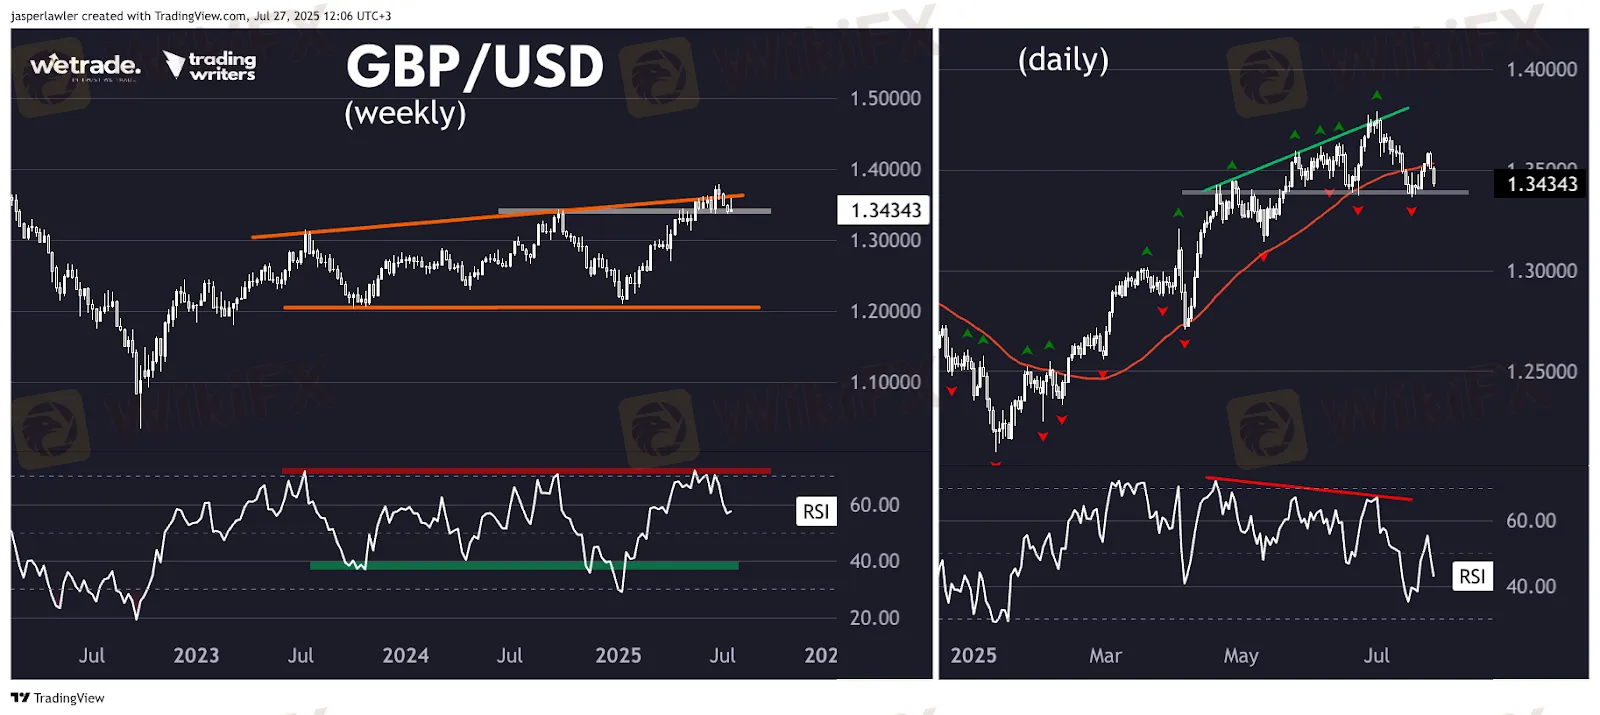
GBP/USDSetup
Price has pulled back from a rising trendline, while RSI is dropping back from the 70 overbought level - as it has on the last two occasions. Price is now testing the 2024 resistance as support- a breakdown from which could spur a drop further into the old price range.
Signal
The last three peaks in RSI have happened below overbought territory, showing momentum in the uptrend supported by the rising 50 day SMA has slowed - and have created bearish divergence with the higher peaks in price. A close below 1.34 would confirm the uptrend has ended.
But - as always - thats just how the team and I are seeing things, what do you think?
Share your ideas with us OR send us a request!
Disclaimer:
Le opinioni di questo articolo rappresentano solo le opinioni personali dell’autore e non costituiscono consulenza in materia di investimenti per questa piattaforma. La piattaforma non garantisce l’accuratezza, la completezza e la tempestività delle informazioni relative all’articolo, né è responsabile delle perdite causate dall’uso o dall’affidamento delle informazioni relative all’articolo.
WikiFX Trader
STARTRADER
FXTM
EC Markets
FBS
FXTRADING.com
Vantage
STARTRADER
FXTM
EC Markets
FBS
FXTRADING.com
Vantage
WikiFX Trader
STARTRADER
FXTM
EC Markets
FBS
FXTRADING.com
Vantage
STARTRADER
FXTM
EC Markets
FBS
FXTRADING.com
Vantage
Rate Calc

