简体中文
繁體中文
English
Pусский
日本語
ภาษาไทย
Tiếng Việt
Bahasa Indonesia
Español
हिन्दी
Filippiiniläinen
Français
Deutsch
Português
Türkçe
한국어
العربية
Crude Oil Price Recovery May Be Running Out of Steam
요약:Crude oil prices may turn lower if technical signs of ebbing upside momentum find follow-through. API inventory flow data is on tap ahead.
CRUDE OIL & GOLD TALKING POINTS:
Crude oil price chart still warning of ebbing upside momentum
EIA inventory flow data on tap, baseline envisions modest build
Gold prices may struggle for direction before FOMC rate call
Crude oil prices rose Monday, with the cycle-sensitive commodity tracking broadly in line with a pickup in risk appetite. The bellwether S&P 500 stock index rose for a second day, closing at a five-month high. It probably didnt hurt that OPEC+ officials recommitted themselves to a coordinated output cut scheme, even though the decision to extend it past mid-year looks to have been delayed until June.
Gold prices were little-changed, edging narrowly higher but ultimately failing to make headway past familiar near-term ranges. The standstill probably echoes similar torpor in Treasury bond yields and the US Dollar as the markets wait for Wednesdays FOMC rate decision before committing to a directional bias on assets driven by the outlook for monetary policy.
US DURABLE GOODS AND FACTORY ORDERS, API OIL INVENTORY STATS DUE
Looking ahead, oil is eyeing weekly API inventory flow data. It will be judged against bets on a modest 632k inflow expected to be reported in official EIA statistics later in the week. Gold might see a bit of near-term volatility as US durable goods and factory orders figures are released but lasting follow-through is probably unlikely until Fed Chair Powell and company have had their say.
See our guide to learn about the long-term forces driving crude oil prices!
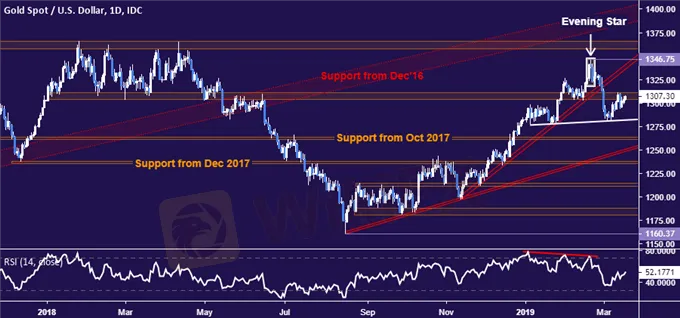
GOLD TECHNICAL ANALYSIS
Gold prices might be carving out a choppy Head and Shoulders top below $1350/oz. A daily close below neckline support – now at 1282.11 – would act as confirmation, initially exposing the 1260.80-63.76 area but broadly implying a larger decline toward 1220. Alternatively, a daily close above resistance in the 1303.70-10.95 region opens the door for a move to revisit the February swing top at 1346.75.
CRUDE OIL TECHNICAL ANALYSIS
Crude oil prices fell just shy of breaking resistance in the 57.96-59.05 area. Meanwhile, negative RSI divergence continues to warn of a bearish reversal in the works. A daily close below support in the 54.55-55.66 area sets the stage for a test of the 50.15-51.33 zone. Alternatively, a confirmed break higher paves the way for a retest of trend line support-turned-resistance a trend line set from February 2016, now at 62.63.

면책 성명:
본 기사의 견해는 저자의 개인적 견해일 뿐이며 본 플랫폼은 투자 권고를 하지 않습니다. 본 플랫폼은 기사 내 정보의 정확성, 완전성, 적시성을 보장하지 않으며, 개인의 기사 내 정보에 의한 손실에 대해 책임을 지지 않습니다.
WikiFX 브로커
최신 뉴스
미래를 위한 필수 전략, 자산 포트폴리오
 WikiFX
WikiEXPO 글로벌 전문가 인터뷰: 진다오 타이(JinDao Tai) — 외환 거래의 미래
WikiFX환율 계산기

