简体中文
繁體中文
English
Pусский
日本語
ภาษาไทย
Tiếng Việt
Bahasa Indonesia
Español
हिन्दी
Filippiiniläinen
Français
Deutsch
Português
Türkçe
한국어
العربية
VIX Curve Inversion: A Bad Omen For the S&P 500
요약:VIX Curve Inversion: A Bad Omen For the S&P 500
VIX Analysis and Talking Points:
Is Volatility Back on the Rise?
Record VIX Net Short Positioning
VIX Curve Inversion: Bad Omen for Equity Markets
See our quarterly forecast to learn what will drive prices throughout Q2!
Is Volatility Back on the Rise?
US equities have come under notable pressure throughout the week with the S&P 500 down over 2%. Consequently, this has coincided with a jump in the VIX (the fear gauge), which closed at its highest level since January after President Trump upped the ante against China, having tweeted that the US will raise the tariff rate to 25% from 10% on $200bln worth of Chinese goods.
VIX PRICE CHART: Daily Time-Frame (Aug 2018-May 2019)
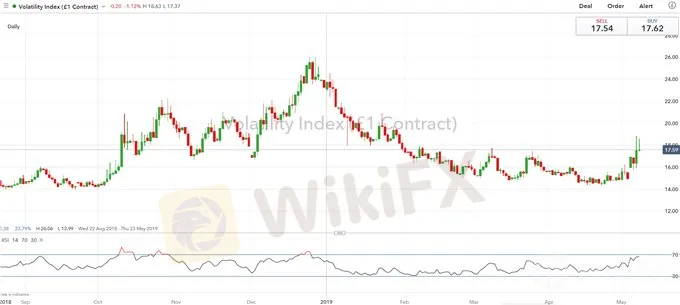
Throughout 2019, US equities have enjoyed a period of subdued volatility with the VIX dropping over 40% since the December 2018 highs. In turn, this saw the S&P 500 gain over 17% to hit fresh record highs amid increased hopes of a trade deal, alongside a dovish pivot from the Federal Reserve, while recession fears had also receded. However, with the VIX back on the rise, this poses a threat to the relatively lofty levels in US equity markets.

Record VIX Net Short Positioning
Amid the latest surge in the volatility index, questions will be raised as to whether we will likely see a VIX blowout that we witnessed last February (full story) given the record short positioning in VIX futures. While positioning may be extreme on both outright net shorts (180k contracts) and as a ratio of open interest (40%), fears of a VIX blowout similar to that of February 2018 may be misplaced with open interest noticeably lower at 450k, from 650k back in early 2018. Alongside this, after last years event many inverse volatility ETPs had also been terminated, however, this does not rule out that volatility can be elevated.

VIX Curve Inversion: Bad Omen for Equity Markets
Following the rising trade war tensions between the US and China, the VIX futures curve has inverted. Typically, the VIX curve tends to be in contango, meaning that the curve is upward sloping with investors more uncertain about the longer-term outlook relative to the short term. However, amid the aforementioned trade war tensions, the front month is now trading above the second month by 63bps, leading to a VIX curve inversion (backwardation). This implies that equity investors are much more concerned in the short-term but given that the front month contract expires on May 22nd, this does suggest that higher volatility may not persist. That being said however, VIX curve inversions have preceded equity market routs, most notably when the curve inverted last year on February 2nd, the S&P 500 plunged over 6% in the following sessions,

DAILYFX TRADING RESOURCES:
See our quarterly forecast to learn what will drive prices through mid-year!
Just getting started? See our beginners guide for FX traders
Having trouble with your strategy? Heres the #1 mistake that traders make
--- Written by Justin McQueen, Market Analyst
To contact Justin, email him at Justin.mcqueen@ig.com
Follow Justin on Twitter @JMcQueenFX
면책 성명:
본 기사의 견해는 저자의 개인적 견해일 뿐이며 본 플랫폼은 투자 권고를 하지 않습니다. 본 플랫폼은 기사 내 정보의 정확성, 완전성, 적시성을 보장하지 않으며, 개인의 기사 내 정보에 의한 손실에 대해 책임을 지지 않습니다.
WikiFX 브로커
최신 뉴스
한국 경제, ‘반짝 성장’ 후 둔화… 원·달러 환율 어디로 갈까?
 WikiFX
외환 투자에서 사기 브로커의 위험을 피하는 방법 | WikiFX, 규제 라이선스를 통해 리스크 식별 지원
WikiFX환율 계산기

