简体中文
繁體中文
English
Pусский
日本語
ภาษาไทย
Tiếng Việt
Bahasa Indonesia
Español
हिन्दी
Filippiiniläinen
Français
Deutsch
Português
Türkçe
한국어
العربية
US Dollar Technical Outlook Versus PHP, SGD, MYR and INR Bearish?

요약:Will the US Dollar see near-term losses against the Philippine Peso, Singapore Dollar and Malaysian Ringgit? Technical signals seem to point in that direction as FOMC minutes near.
USD/PHP, USD/SGD, USD/MYR, USD/INR Talking Points
US Dollar at risk to losing upside momentum versus ASEAN FX in near-term
Philippine Peso, Singapore Dollar and Malaysian Ringgit eyeing breakouts
USD/INR uptrend faces its next critical psychological barrier, will it hold?
USD/PHP Technical Outlook
The Philippine Peso may find itself outperforming against the US Dollar as it looks to confirm a Bearish Engulfing candlestick pattern. USD/PHP is on the verge of extending losses under the near-term rising trend line from the beginning of August. That places the focus on support at 51.86. Otherwise, a false breakout may result in uptrend resumption towards 52.73.Fundamentally, FOMC minutes may boost USD.
USD/PHP Daily Chart
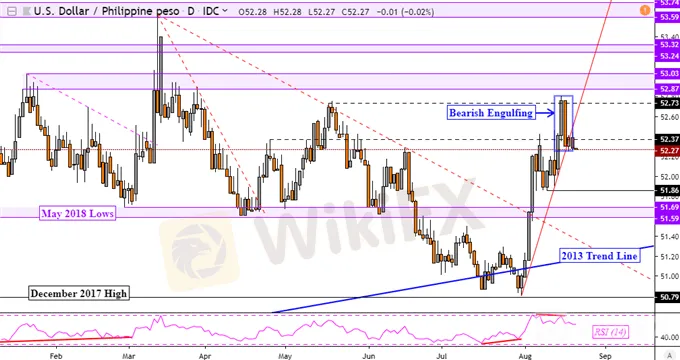
USD/PHP Chart Created in TradingView
USD/SGD Technical Outlook
The US Dollar is looking increasingly vulnerable to the Singapore Dollar after USD/SGD formed an Evening Star bearish reversal pattern. This followed fading upside momentum noted last week, with the currency pair now looking to confirm closes under the rising support line from the middle of July. Further declines under support, which is a range between 1.3808 and 1.3836, opens the door to reversal confirmation.
USD/SGD Daily Chart

USD/SGD Chart Created in TradingView
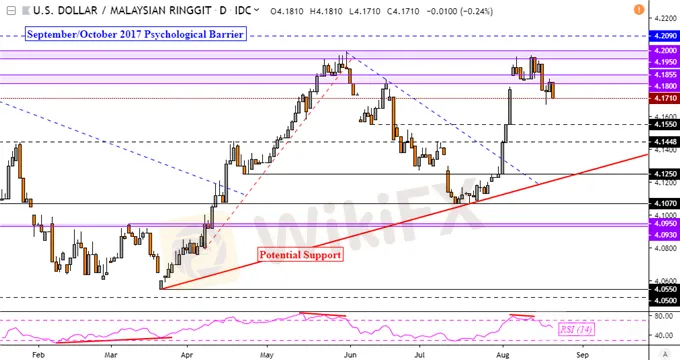
USD/MYR Technical Outlook
Meanwhile, the US Dollar is also at risk to the Malaysian Ringgit after USD/MYR confirms a close under support at 4.1800. That opens the door to a reversal of the near-term uptrend from the middle of July. In the medium-term, the currency pair may test potential rising support from March (red line below). Along the way stands areas of support around 4.1550 and 4.1448.
USD/MYR Daily Chart
USD/INR Technical Outlook
Focusing on the Indian Rupee, the US Dollar has managed to extend gains despite fading upside momentum. This is represented as negative RSI divergence on the chart below. This comes as USD/INR faces the next critical psychological barrier between 71.53 and 71.82 after the break above descending resistance – from October 2018. If resistance holds, a turn lower places support at 70.88. Otherwise, a climb eyes 72.55.
USD/INR Daily Chart

USD/INR Chart Created in TradingView
FX Trading Resources
면책 성명:
본 기사의 견해는 저자의 개인적 견해일 뿐이며 본 플랫폼은 투자 권고를 하지 않습니다. 본 플랫폼은 기사 내 정보의 정확성, 완전성, 적시성을 보장하지 않으며, 개인의 기사 내 정보에 의한 손실에 대해 책임을 지지 않습니다.
WikiFX 브로커
환율 계산기

