简体中文
繁體中文
English
Pусский
日本語
ภาษาไทย
Tiếng Việt
Bahasa Indonesia
Español
हिन्दी
Filippiiniläinen
Français
Deutsch
Português
Türkçe
한국어
العربية
Stocks Eye European Data, Can S&P 500 Uptrend Pass Key Resistance?

Абстракт:Asia stocks traded mixed as markets await potentially risk-negative European data. In its near-term uptrend, can the S&P 500 break key resistance should sentiment prevail
Asia PacificMarkets Wrap Talking Point
APAC equities traded mixed after US markets were offline, Nikkei 225 rose
AUD/USD fell on RBA meeting minutes as dovish BoJ trimmed JPY gai
All eyes on German, Eurozone ZEW surveys. S&P 500 eyeing key resistance
Find out what retail traders equities buy and sell decisions say about the coming price trend!
After US markets were offline and a slight dose of risk aversion was added, Asia Pacific benchmark stock indexes traded mixed. The Nikkei 225 and ASX 200 saw gains ranging above 0.2% as we headed into Tuesday‘s close. China’s Shanghai Composite was relatively flat while South Koreas KOSPI aimed about 0.3% to the downside.
Looking at foreign exchange markets revealed a somewhat ‘risk-off’ trading dynamic. Both the sentiment-linked Australian and New Zealand Dollars traded lower against their major counterparts. As anticipated, the RBA meeting minutes ultimately sent AUD/USD to the downside as the central bank offered more details to their increasingly neutral policy outlook. This is as opposed to favoring a hike down the road.
While the anti-risk Japanese Yen was higher, gains were trimmed on dovish commentary from BoJs Governor Haruhiko Kuroda. This also offered a slight boost to the Nikkei 225. Looking ahead, S&P 500 futures are pointing narrowly lower. The upcoming German and Eurozone ZEW sentiment surveys may disappoint, fueling risk aversion and presenting knock-on effects for ASEAN currencies as the US Dollar appreciates.
S&P 500 Technical Analysi
These next few days will be quite interesting for the S&P 500 if sentiment ends up prevailing instead. Ahead lays a range of resistance between 2785.93 and 2816.94. Should this be cleared, it could set itself up for paring losses from its dramatic plunge towards the end of 2018. Should it turn lower in the interim, near term support appears to be a rising trend line from January.
S&P 500 Daily Chart
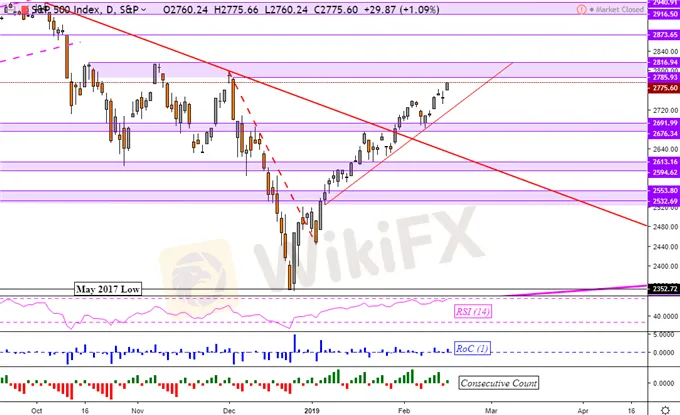
Chart created in TradingView
Отказ от ответственности:
Мнения в этой статье отражают только личное мнение автора и не являются советом по инвестированию для этой платформы. Эта платформа не гарантирует точность, полноту и актуальность информации о статье, а также не несет ответственности за любые убытки, вызванные использованием или надежностью информации о статье.
WikiFX брокеры
Подсчет курса

