简体中文
繁體中文
English
Pусский
日本語
ภาษาไทย
Tiếng Việt
Bahasa Indonesia
Español
हिन्दी
Filippiiniläinen
Français
Deutsch
Português
Türkçe
한국어
العربية

Gold Price Outlook: May Opening Range on Radar Following Fed Meeting
摘要:Gold retraces the decline following the FOMC meeting, but the broader outlook warns of a shift in market behavior as a head-and-shoulders formation remains in play.
Gold prices were battered at the start of the month as the Federal Open Market Committee (FOMC)showed no interest in altering the monetary policy outlook, and it seems as though the central bank will stick to the sidelines going into the second-half of the year as Chairman Jerome Powell & Co. ‘don't see a strong case for moving in either direction.’
It seems as though the FOMC is in no rush to alter the forward-guidance for monetary policy as the ‘baseline view remains that, with a strong job market and continued growth, inflation will return to 2 percent over time,’ and the central bank may continue to endorse a wait-and-see approach at the next quarterly meeting in June as the committee starts to winddown the $50B/month in quantitative tightening (QT).
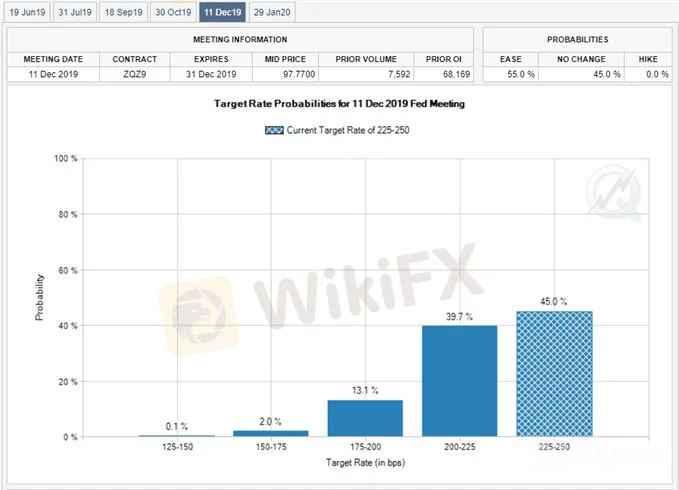
Nevertheless, Fed Fund Futures still reflect a greater than 50% probability for a December rate-cut even though the FOMC insists that ‘incoming data since our last meeting in March have been broadly in line with ourexpectations,’ and it remains to be seen if Chairman Powell & Co. will continue to project a longer-run interest rate of 2.50% to 2.75% as ‘transitory factors’ appear to be dragging on inflation.
With that said, comments coming out of the FOMC may continue to impact gold as a slew of Fed officials are scheduled to speak over the coming days, and a batch of less-dovish comments may drag on the price of bullion as it raises the scope for higher U.S. interest rates.
Keep in mind, there appears to be a broader shift in market behavior as the price for bullion snaps the 2019 opening range, and the precious metal may continue to give back the advance from the 2018-low ($1160) as a head-and-shoulders formation remains in play.
Gold Price Daily Chart

The broader outlook for gold remains mired by the head-and-shoulders formation amid the break of neckline support, with the Relative Strength Index (RSI) highlighting a similar dynamic as it tracks the bearish trends from earlier this year.
However, the price for bullion now threatens the opening range for May after failing to clear the April-low ($1266), with recent series of higher highs & lows raising the risk for a larger recovery.
Need a break/close above $1288 (23.6% expansion) to open up the Fibonacci overlap around $1298 (23.6% retracement) to $1302 (50% retracement), with the next region of interest coming in around $1315 (23.6% retracement) to $1316 (38.2% expansion).
Nevertheless, failure to break out of the monthly opening range may bring the downside targets back on the radar, with the first area of interest coming in around $1260 (23.6% expansion).
For more in-depth analysis, check out the 2Q 2019 Forecast for Gold
Additional Trading Resources
Are you looking to improve your trading approach? Review the ‘Traits of a Successful Trader’ series on how to effectively use leverage along with other best practices that any trader can follow.
Want to know what other markets the DailyFX team is watching? Download and review the Top Trading Opportunities for 2019.
--- Written by David Song, Currency Strategist
Follow me on Twitter at @DavidJSong.
免责声明:
本文观点仅代表作者个人观点,不构成本平台的投资建议,本平台不对文章信息准确性、完整性和及时性作出任何保证,亦不对因使用或信赖文章信息引发的任何损失承担责任
天眼交易商
热点资讯
存股还是屯黄金 本想找个挡风雨的人,没想到风雨都是他带来的!
 WikiFX
大揭秘:JRJR金荣中国还敢做吗?他们交易的不是伦敦金
WikiFX只是因为无聊在微信上多看了“她”一眼 他跌入公众号炒汇泥潭暴亏3万美元
WikiFX汇率计算

