简体中文
繁體中文
English
Pусский
日本語
ภาษาไทย
Tiếng Việt
Bahasa Indonesia
Español
हिन्दी
Filippiiniläinen
Français
Deutsch
Português
Türkçe
한국어
العربية

Gold Price Forecast: RSI Sell Signal Takes Shape
摘要:The price of gold stands at risk for a larger pullback as the Relative Strength Index (RSI) falls back from overbought territory and flashes a textbook sell signal.
Gold Price Talking Points
The price of gold stands at risk for a larger pullback as the Relative Strength Index (RSI) finally falls back from overbought territory, but current market conditions may keep the precious metal afloat as market participants look for an alternative to fiat currencies.
Gold Price Forecast: RSI Sell Signal Takes Shape
The near-term rally in gold appears to have stalled as the US delays the next tranche of China tariffs to December 15, and the price for bullion may continue to pullback from the yearly-high ($1535) as President Donald Trump tweets we are doing very well with China and talking.
Fears of a US-China trade war may continue to abate as the two regions reengage in negotiations, but little signs of a looming trade deal may push the Federal Open Market Committee (FOMC) to insulate the US economy as “weak global growth, trade policy uncertainty, and muted inflation have prompted the FOMC to adjust its assessment of the appropriate path of interest rates.”
It seems as though the Federal Reserve will continue to change its tune over the remainder of the year as the central bank pledges to “act as appropriate to sustain the expansion,” and the FOMC Minutes due out later this week may hint at a more accommodative stance as “many Committee participants saw that the case for lowering the federal funds rate had strengthened.”
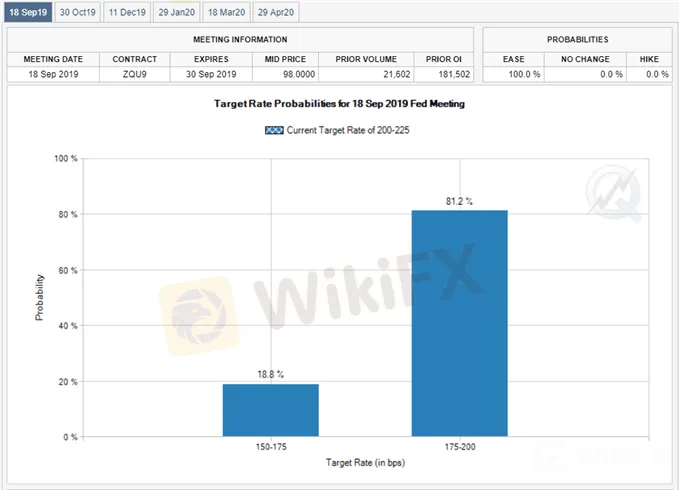
In turn, Fed Fund futures continue to reflect a 100% probably for at least a 25bp reduction at the next interest rate decision on September 18, and the FOMC may come under increased pressure to implement a rate easing cycle as President Trump insists that “the Fed is holding us back.”
With that said, falling US Treasury yields along with the inverting yield curve may push market participants to hedge against fiat currencies, and the risk of a policy error may keep gold prices afloat as there appears to be a flight to safety.
Sign up and join DailyFX Currency Strategist David Song LIVE for an opportunity to discuss potential trade setups.
Gold Price Daily Chart

Source: Trading View
Keep in mind, the broader outlook for gold prices remain constructive as both price and the Relative Strength Index (RSI) clear the bearish trends from earlier this year.
Moreover, gold has broken out of a near-term holding pattern following the failed attempt to close below the $1402 (78.6% expansion) region, with the RSI still tracking the bullish formation from April.
However, recent developments in the RSI warn of a larger pullback as the oscillator falls below 70 and flashes a textbook sell signal.
In turn, a break/close below $1488 (61.8% expansion) opens up the $1467 (50% expansion) hurdle, with the next area of interest coming in around $1457 (100% expansion).
Will keep a close eye on the former-resistance zone around $1444 (161.8% expansion) to $1448 (382.% retracement) for potential support.
For more in-depth analysis, check out the 3Q 2019 Forecast for Gold
Additional Trading Resources
Are you looking to improve your trading approach? Review the ‘Traits of a Successful Trader’ series on how to effectively use leverage along with other best practices that any trader can follow.
Want to know what other currency pairs the DailyFX team is watching? Download and review the Top Trading Opportunities for 2019.
免责声明:
本文观点仅代表作者个人观点,不构成本平台的投资建议,本平台不对文章信息准确性、完整性和及时性作出任何保证,亦不对因使用或信赖文章信息引发的任何损失承担责任
天眼交易商
热点资讯
存股还是屯黄金 本想找个挡风雨的人,没想到风雨都是他带来的!
 WikiFX
大揭秘:JRJR金荣中国还敢做吗?他们交易的不是伦敦金
WikiFX只是因为无聊在微信上多看了“她”一眼 他跌入公众号炒汇泥潭暴亏3万美元
WikiFX汇率计算

