简体中文
繁體中文
English
Pусский
日本語
ภาษาไทย
Tiếng Việt
Bahasa Indonesia
Español
हिन्दी
Filippiiniläinen
Français
Deutsch
Português
Türkçe
한국어
العربية
USDJPY Price: Tight Trading Range Ahead of US NFPs
摘要:USDJPY volatility remains low ahead of the latest US Labor report but pivot point analysis shows areas of support and resistance inside the current tight
USDJPY Price, Chart and Analysis:
USDJPY has traded in a 56 pip range this week as traders wait for inspiration.
Retail remain net-short, a bullish contrarian set-up.
Q1 2019 Japanese Yen Analysis and Forecast.
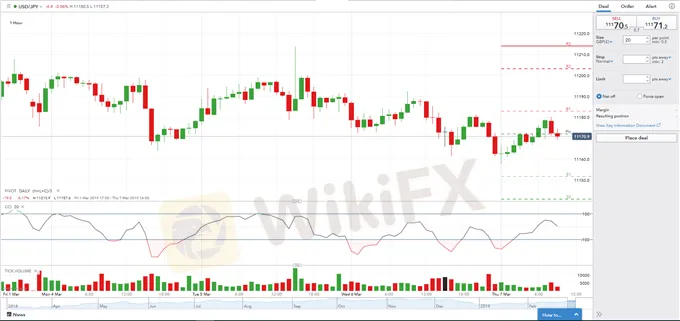
Low volatility – tight trading conditions – is currently a common denominator of most major fx-pairs and USDJPY is no exception. The pair have been stuck in a 56 pip range this week (111.58 – 112.14) making trading difficult. Looking inside this range, pivot points show pivot currently at 111.72 with initial resistance (R1) at 111.83 and first support (S1) at 111.52. The Commodity Channel Index (CCI) is trading in the middle of the -100/+100 range and currently gives no guidance.
Traders are now pinning their hopes on Friday‘s US Non-Farm Payrolls figure to help break this current impasse. Market expectations are currently for +185k new jobs – after last month’s blockbuster +305k - and a 0.3% rise in average hourly earnings (m/m).
USDJPY One-Hour Price Chart (March 1 – March 7, 2019)
IG Client Sentiment data show that retail traders remain net-short of USDJPY, a bullish contrarian set-up, with retail increasing their short-positions by 18.6% over the last week, increasing this bullish bias.

Traders may be interested in two of our trading guides – Traits of Successful Traders and Top Trading Lessons – while technical analysts are likely to be interested in our latest Elliott Wave Guide.
What is your view on the USDJPY – bullish or bearish? You can let us know via the form at the end of this piece or you can contact the author at nicholas.cawley@ig.comor via Twitter @nickcawley1.
免責聲明:
本文觀點僅代表作者個人觀點,不構成本平台的投資建議,本平台不對文章信息準確性、完整性和及時性作出任何保證,亦不對因使用或信賴文章信息引發的任何損失承擔責任
天眼交易商
熱點資訊
Finaxen Trade Pips遭英國FCA點名示警,網站突然關閉疑爆雷跑路
 WikiFX
外匯交易失敗率那麼高、容易虧錢,為何還是很多人參與?
WikiFXWeltrade活動翻車?投資人怒曝領不到iPhone、獎勵被沒收,疑遭平台割韭菜
WikiFXPU Prime 推出活躍交易者專屬的 VPS 費用返還優惠
WikiFXLoyal Primus推高槓桿、低門檻、贈金多吸客,這家外匯券商可信嗎?
WikiFX又見高風險平台?Nova Finance監管疑似套牌,先後遭法國AMF、加拿大CSA示警
WikiFX一位交易者的心靈修行
WikiFX匯率計算

