简体中文
繁體中文
English
Pусский
日本語
ภาษาไทย
Tiếng Việt
Bahasa Indonesia
Español
हिन्दी
Filippiiniläinen
Français
Deutsch
Português
Türkçe
한국어
العربية
Gold Prices Eyes Topside Target, Silver Prices Slightly Outperforming Gold
摘要:Gold Prices Eyes Topside Target, Silver Prices Slightly Outperforming Gold
Gold & Silver Price Analysis and Talking Points:
Gold Price Outlook Remains Bullish
Silver Prices Slightly Outperforming Gold
See our quarterly gold forecast to learn what will drive prices throughout Q3!
Gold Price Outlook Remains Bullish
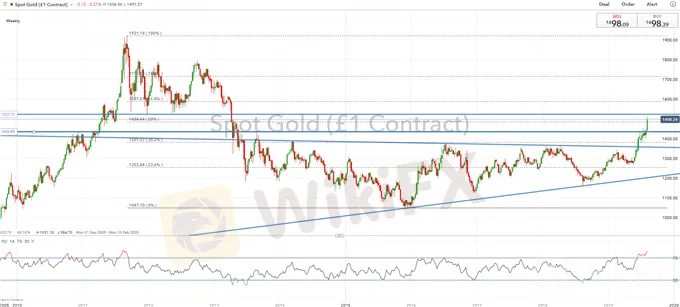
Despite the US Dollar holding up relatively well in recent sessions, gold prices have continued to extend on its gains, hitting fresh 6yr highs at $1500 amid the plunge in global bond yields. As the drop-in bond yields persist, the opportunity cost of holding gold continues to diminish. However, given the size of the move in gold in recent sessions, there is a potential risk of slight exhaustion, thus making the risk reward for a further move higher at current levels slightly less attractive. As such, eyes will be on for a potential pullback for a better opportunity to have a bullish bias. That said, the medium-term outlook continues to remain bullish for the precious metal as the Federal Reserve continue to ease policy, while trade war tensions weigh on economic performance. Topside targets would be for a break of $1522 to open a move towards $1550.
GOLD Technical Levels
Resistance 1: $1522 (Triple Bottom)
Support 1: $1433 (August 2013 High)
Support 2: $1381 (38.2% Fib)
GOLD PRICE CHART: Daily Time-Frame (Sep 2009 -Aug 2019)
What You Need to Know About the Gold Market
Silver Price Outlook | Slightly Outperforming Gold
Silver prices have surged higher following a clean break of the descending trendline stemming from the November 2016 peak. In turn, this has seen silver prices push through the $17 level. Silver has continued to outperform gold prices as the gold/silver ratio heads lower, albeit ever so slightly. On the technical front, topside resistance resides at $17.54, which marks the 50% fib from the 2016 peak to the 2018 low. While a slight negative divergence on the RSI raises the risk of a slight pullback.
Silver Price Chart: Daily Timeframe (Oct 2018 – Jul 2019)

免責聲明:
本文觀點僅代表作者個人觀點,不構成本平台的投資建議,本平台不對文章信息準確性、完整性和及時性作出任何保證,亦不對因使用或信賴文章信息引發的任何損失承擔責任
天眼交易商
熱點資訊
小心踩雷!MERJ監管資訊存疑、涉虛假宣傳,遭投資人點名為詐騙平台
 WikiFX
交易沒有耐心,其他都是浮雲!
WikiFXPro Club Team遭英國FCA列為詐騙風險平台,網站失效疑似已爆雷跑路
WikiFXPipsMasterPro再爆假投資詐騙!高報酬話術誘騙入金,限制大額提領逼繳稅
WikiFX匯率計算

