简体中文
繁體中文
English
Pусский
日本語
ภาษาไทย
Tiếng Việt
Bahasa Indonesia
Español
हिन्दी
Filippiiniläinen
Français
Deutsch
Português
Türkçe
한국어
العربية
Gold Price Surge Continues as Trade War Stokes Global Easing Bets
摘要:Gold prices continued to surge as markets bet that trade war escalation will sink global economic growth and push central banks to drive down interest rates.
GOLD & CRUDE OIL TALKING POINTS:
Gold prices set yet another 6-year high as trade war fuels bets on global easing
Crude oil prices sink as growth outlook sours, US inventories unexpectedly rise
Bare data docket may allow consolidation, but volatility risk is still acutely high
Gold prices continued to rise Wednesday as building expectations of broad-based monetary stimulus expansion buoyed the relative appeal of non-interest-bearing alternatives. Financial markets are positioning for central banks to push back as trade war escalation compounds a slowdown in global economic growth on-going since early 2018.
Not surprisingly, this made for a less-than-supportive backdrop for cycle-sensitive crude oil prices. EIA inventory data showing stockpiles unexpectedly added 2.39 million barrels last week compounded selling pressure, sending the WTI benchmark to levels unseen since January. Reports citing an unnamed Saudi official saying the kingdom will not tolerate continued weakness helped prices steady a bit late into the session.
From here, a quiet day on the economic data docket might offer shell-shocked global markets a bit of space to consolidate. The risk of kneejerk volatility remains decidedly acute however. Indeed, a stray bellicose comment from officials in Washington or Beijing might trigger another dramatic rout across the spectrum of sentiment-geared assets at a moments notice.
Get our free guide to help build confidence in your gold and crude oil trading strategy!
GOLD TECHNICAL ANALYSIS
Gold prices have challenged resistance marked by the 61.8% Fibonacci expansion at 1513.94. A break above that confirmed on a daily closing basis exposes the 76.4% level at 1540.70. Alternatively, a turn back below the 50% Fib at 1492.31 sets the stage for a retest of the 38.2% expansion at 1470.68.
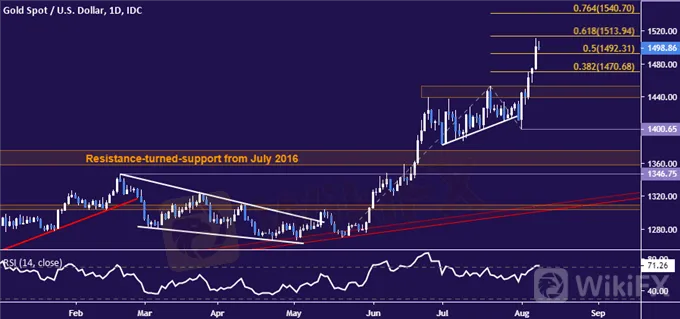
Gold price chart created using TradingView
CRUDE OIL TECHNICAL ANALYSIS
Crude oil prices fell to a two-month low near the $50/bbl figure, as expected. A daily close below the outer layer of support at 49.41 sets the stage to challenge the 42.05-43.00 zone, a barrier capping losses since September 2016. Alternatively, a move above resistance at 56.09 targets a falling trend line at 59.16.

Crude oil price chart created using TradingView
免責聲明:
本文觀點僅代表作者個人觀點,不構成本平台的投資建議,本平台不對文章信息準確性、完整性和及時性作出任何保證,亦不對因使用或信賴文章信息引發的任何損失承擔責任
天眼交易商
熱點資訊
PU Prime 與阿根廷足球協會(AFA)攜手合作,擴大全球品牌影響力
 WikiFX
ZFX 的姊妹差價合約品牌Traze進軍中東市場:已取得杜拜牌照
WikiFXVtros平台出金卡關、無監管加持、遭英國FCA示警,恐成下一個爆雷平台
WikiFX外匯交易中為何會出現滑點?
WikiFX3/31-4/6高風險外匯詐騙平台示警
WikiFX點差低、槓桿高,卻存監管與實勘爭議?外匯券商BlackBull紐市可以信任嗎?
WikiFX英國創新金融協會祝賀WikiEXPO展會成功舉辦,並與外匯天眼攜手共築安全金融未來
WikiFXKODDPA近期傳多起交易糾紛!宣稱系統遭駭帳戶歸零,要求用戶繳稅才能出金
WikiFX匯率計算

